The Cardano price analysis shows that the ADA market has been on a steady uptrend since its lowest point of $0.3580 on May 21st. The bulls have been pushing the price higher as it is retraced above the key resistance level of $0.3700. However, the selling pressure has been imminent since ADA has been closing below the $0,3700 level before trading sideways.
At the moment, the ADA/USD pair is trading at $0.3701 with a gain of 0.60 percent in the past 24 hours. ADA/USD pair is facing a strong level of resistance at the $0.3750 mark and if it closes above this level, then it will enter a new phase of bullishness. On the downside, there seems to be some underlying support for ADA at its current trading price around the $0.3666 level as seen from the daily chart. If it holds here, then there is a potential for ADA to rise further.
Cardano price analysis 1-day chart: ADA/USD face resistance at the $0.3750 mark
The 1-day chart for Cardano price analysis shows that ADA/USD pair kicked off today’s trading session below $0.3700 before the bulls took control of the market and pushed it higher. ADA/USD pair managed to reach a high of $0.3752 before correcting itself downwards again as the bears put pressure on the market from the $0.3750 resistance level. The trading volume today shows a decrease of 16.15 percent with the value standing at $143 million.
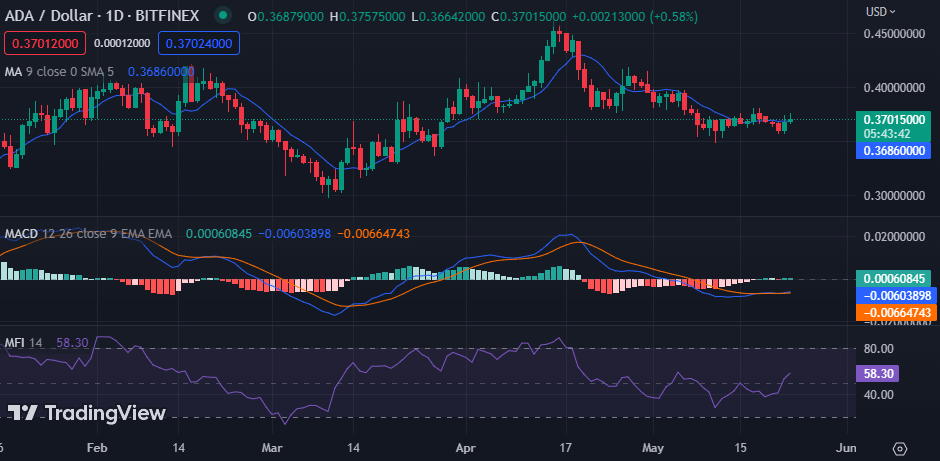
On the technical indicators, ADA/USD pair is trading above the 50-day moving average, indicating a bullish momentum in the market. Furthermore, the MACD line has crossed from below zero to above zero which is another sign of a bull trend continuation. The histogram is heading upwards as well, indicating a stronger buying sentiment in the market despite a decrease in the trading volume today. The Money Flow Index (MFI) is currently at 58.17, indicating that the market is neutral in nature at the moment, and if the buying pressure increases, we could see ADA/USD pair retesting the $0.3750 resistance level.
Cardano price analysis hourly chart: Latest developments
On the 4-hour chart, Cardano’s price analysis reveals that ADA/USD pair has been trading in a range between $0.3690 and $0.3710 in the past few hours. The price action is showing no clear direction as it consolidates sideways within the boundaries of this range. ADA’s market in the past 1 hour shows a decrease of 0.03 percent with the price settling at the $0.3701 mark.
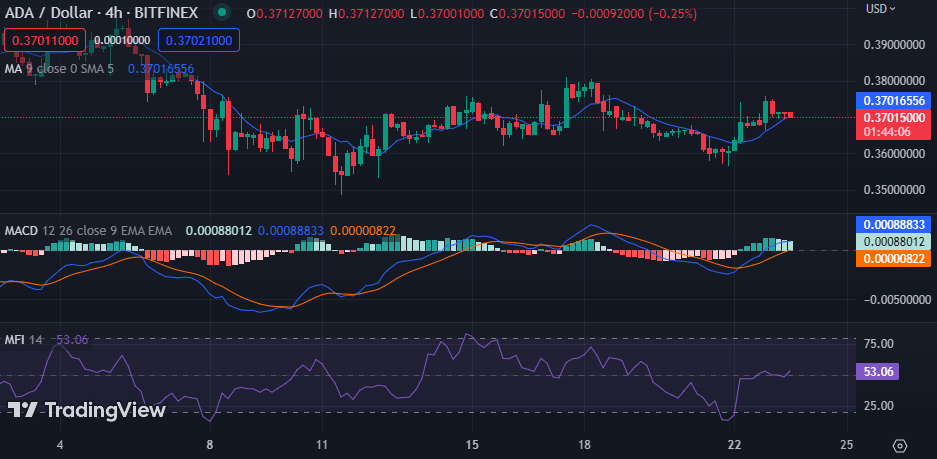
Technical indicators on the 4-hour chart are indicating a neutral market. The Money Flow Index (MFI) indicator is currently at 54.04, which lies in between the overbought and oversold regions. The MACD line has been trading sideways, with both the signal and histogram lines losing their momentum as they slope down on the chart. The moving average (MA) has changed its upward trend and the chart has started to print red candlesticks which indicates that the bulls are losing their grip on the market.
Cardano price analysis conclusion
In conclusion, Cardano price analysis has been bullish today. The bulls have managed to push the ADA/USD pair above the $0.3700 level and are currently trying to break the resistance at the $0.3750 mark. The buyers need to gather more momentum if they are to break the $0.3750 resistance level and if they fail, then we could see ADA/USD pair reverting back towards the $0.3600 level.