Cardano price analysis shows an increase in price today after a few days of declines. The digital asset is currently trading above the $0.3500 level as bulls are struggling to gain traction. The pair rose to an intraday high of $0.3537 as buying pressure re-emerged after a shallow pullback.
The support level for ADA/USD is present at $0.3318, while the resistance level is at $0.3545. The digital asset could extend gains above the $0.3500 mark if buyers manage to push prices higher in the short term. If they fail, ADA/USD could return to the $0.3318 support level.
Cardano price analysis 1-day chart: ADA/USD rises above the $0.3500 level
The 1-day chart for Cardano price analysis reveals that the digital asset’s price is trading in a range-bound channel. The pair has successfully tested the lower boundary of this channel at $0.3300 in recent days before climbing above the $0.3500 level today. The ADA/USD gained around 4.57 percent on the day and is currently trading in the green.
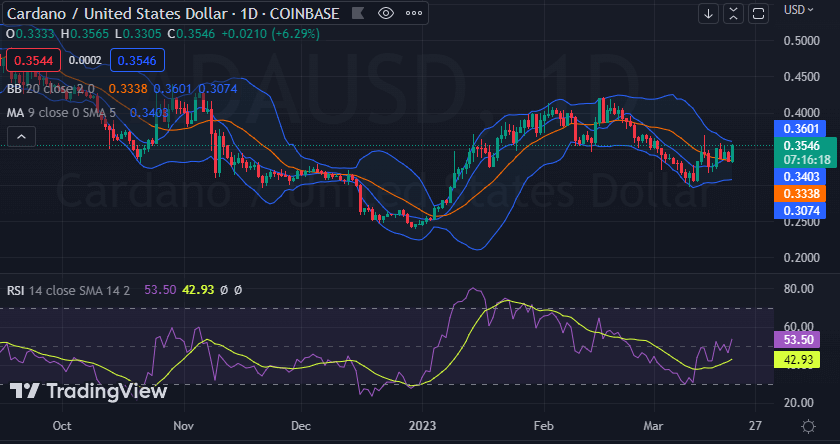
The Relative Strength Index (RSI) is trading on the upward slope at 53.50, indicating, signaling that buyers are slowly regaining control of the market. The moving average indicator is at 0.3403, indicating the presence of an uptrend in the market. The volatility is mild, with the Bollinger bands showing no considerable change, but the lower end of the indicator is traveling slightly upwards. The upper Bollinger band is at $0.3601, and the lower band is at $0.3074, indicating a mild bearish correction.
Cardano price analysis 4-hour chart: Buying pressure prevails at $0.3537
The 4-hour chart for Cardano price analysis reveals that the digital asset is still trading in green. The pair opened today’s trading section in bearish territory and dropped to an intraday low of $0.3382; however, the buying pressure soon began to pick up steam as the momentum shifted in favor of the bulls. This helped ADA/USD climb above the $0.3500 level and reached its present price of $0.3537.
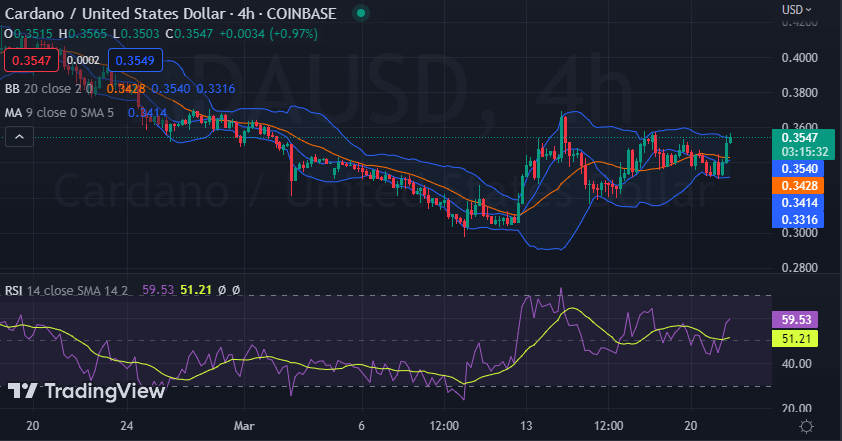
The Relative Strength Index (RSI) is reading 59.53, indicating a neutral market. The moving average indicator is at 0.3414, with 50-day and 200-day moving averages trending downwards. The volatility is moderate, with the Bollinger bands widening slightly after a shallow pullback. The upper Bollinger band is at $0.3540, and the lower band is at $0.3316, indicating sideways trading in the near term.
Cardano price analysis conclusion
Overall, Cardano price analysis shows that ADA price has gained momentum in the past hours and is now trading at $0.3537. The digital asset appears to be gaining traction as buying pressure re-emerges, and if it can break the resistance level of $0.3550, further gains could be seen in the near term. The indicators also suggest bullishness, which could lead to further price gains in the coming days.