Our weekly crypto price analysis reveals that cryptocurrencies were in a slightly bullish trend. It seemed to be a crypto recovery from the November price slump. However, there was no strong breakout to the upside and most of the coins have been hovering near their support levels.
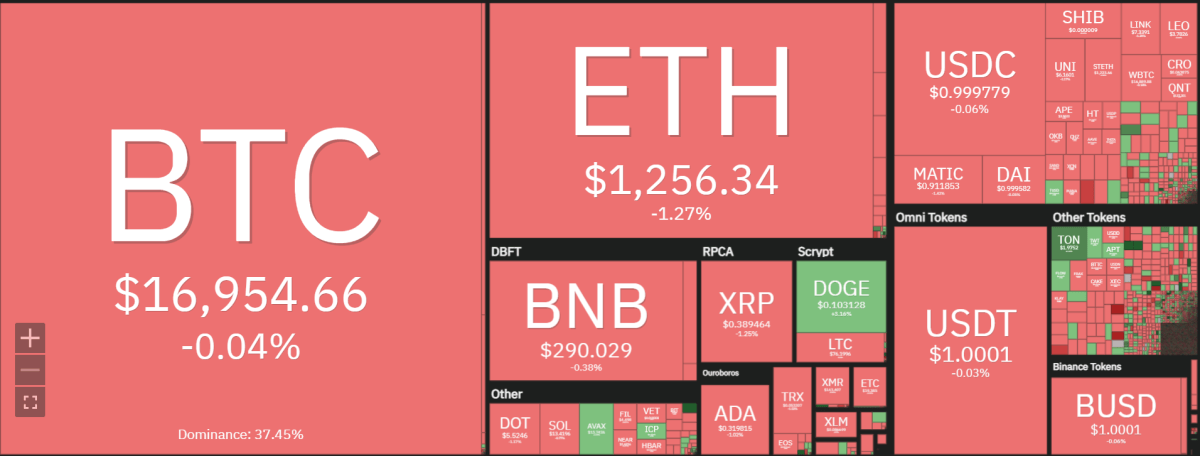
There was a short-lived price spike for Bitcoin, which happened after it breached the $17,000 mark. However, the coin could not sustain this level and quickly fell back to trading around $16,961.10. Ethereum is also stuck in a similar range with no clear signs of an uptrend.
Other altcoins like Uniswap and Terra Classic have registered high points during the week and have since been retracing back toward their support levels. Cryptocurrency prices sifted lower late Sunday as the stock market cooled on the latest inflation data after rocketing on Friday.
According to our weekly crypto price analysis, it seems the cryptocurrencies might trade sideways in the near future. However, there could be some upward momentum if major coins break past their resistance levels.
The crypto market cap created a double-bottom pattern on the weekly chart, which is considered a bullish sign. Dec. 1st’s most interesting crypto market news came from the Wall Street Journal. They stated that with Tether loaning more money, there becomes a greater risk to the cryptocurrency industry. However, Tether released its own statement saying that its loans are well collateralized and don’t present any danger to cryptocurrencies altogether.
Weekly Crypto price analysis: Market cap rises to $851.5 billion
The entire crypto market is increasing despite a few recent price corrections. The market cap has hit $851.5 billion and is still showing signs of a bullish trend, according to our weekly crypto price analysis. Bitcoin dominance also continues to rise as it sits at 37.7 percent. Although this is not a high point for the coin, it’s been on an upward trajectory for the last three days.
The ongoing increase was preceded by a double-bottom pattern and bullish divergence in the RSI (green line). However, the latter has yet to move above 50, which would confirm the bullish trend. Since the Coinmarketcap has reclaimed the $850 billion level, it is likely that we will see a further bullish trend. We will look at the top 10 coins: BTC, ETH, XRP, BNB, ADA, and DOGE from a top-down perspective.
BTC/USD
For Bitcoin (BTC), the price has continued to trade in a range between $16,900-$17,200 for almost five days. As of Dec. 4th’s market analysis, it is currently trading at $16,967.13, barely below the $17,200 resistance level. BTC has made several attempts to break past this level but has not been able to do so.
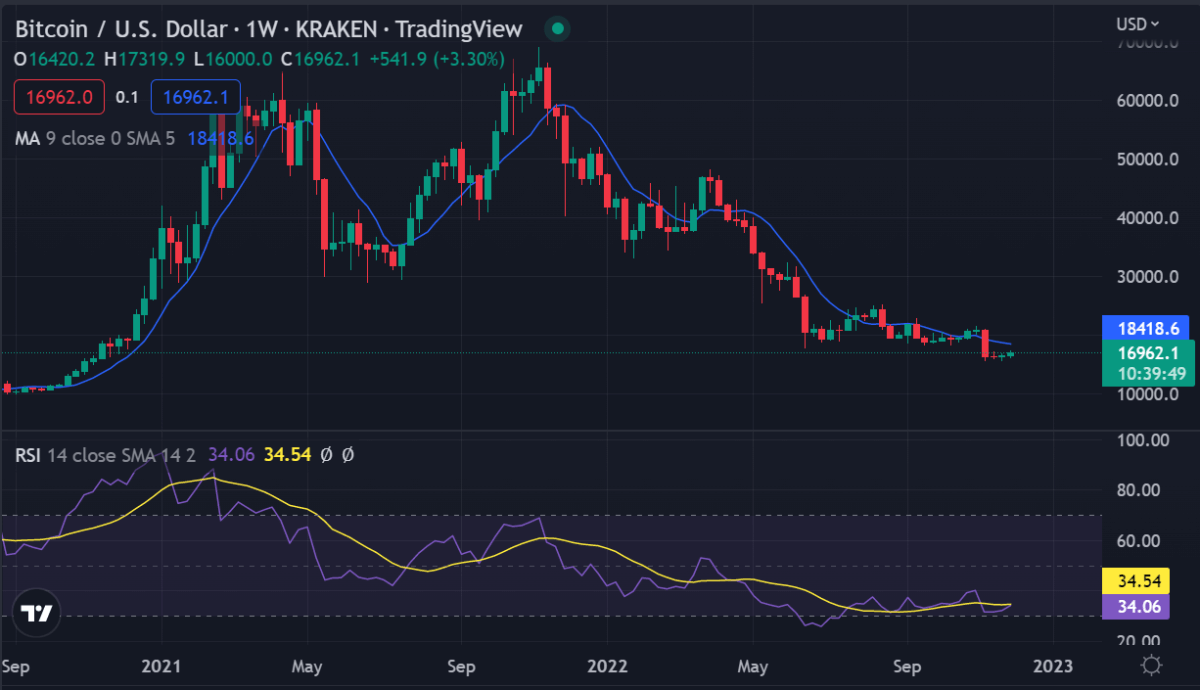
The weekly technical indicators (50-period exponential moving average and Ichimoku cloud) show that a bullish divergence is possible, with the RSI making higher lows while the price making lower lows. The relative strength index (RSI) is just below the midpoint, meaning that there is an equilibrium between supply and demand. This would shift in favor of buyers if they managed to push the price above the overhead resistance at $17,622.58.However, the 20-period exponential moving average has turned flat and the 50-period moving average is turning down.
ETH/USD
From a top-down analysis, Ethereum (ETH) has been hovering between $1,136 and $1,274.20. It is currently trading at $1,257.10 as of Dec. 4th’s market analysis. ETH has also not been able to break past the resistance level and remains stuck in a range with no signs of an uptrend.
If the bears continue to stall the ETH/USDT pair’s recovery at $1,335, there is a higher chance that it will eventually break above. If this occurs, then it could rally up to reach the resistance line of its channel. However, bulls may find this level proves to be quite difficult to surpass.
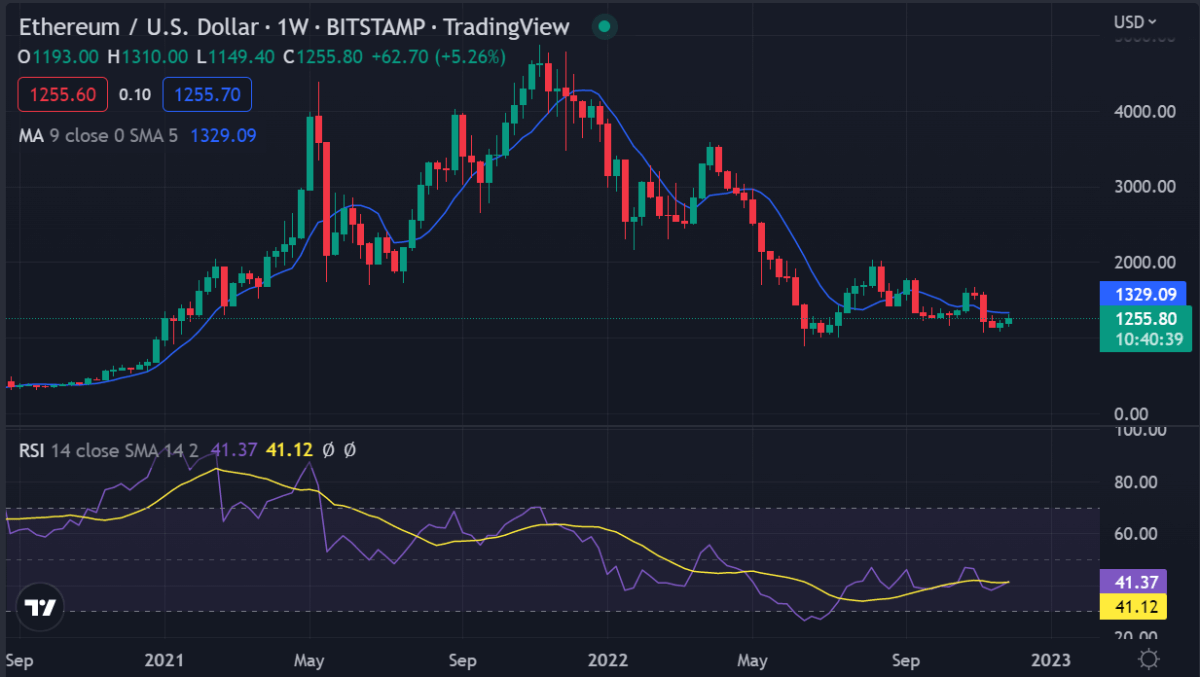
If the price can’t be pushed above the 50-day SMA, it may give bears an opportunity to pull the pair back below the 20-day EMA. The recent gains could then be given up, resulting in a drop to $1,151.
The weekly technical indicators (50-period exponential moving average and Ichimoku cloud) show low bullish divergence. The RSI also shows higher lows as the price makes lower lows, suggesting that a positive change in trend may be coming soon. Still, it is recommended to wait for ETH to break past $1,274.20 before a long position is taken.
XRP/USD
XRP, like the rest of the top 10 cryptos, has been trading in a sideways trajectory since Saturday. On Dec. 1st, it hit $0.4095 but quickly tumbled to as low as $0.3868 on Dec 3rd. At the time of writing, XRP has rallied to $1,257.10 after a slight retracement in price over the last 24 hours.
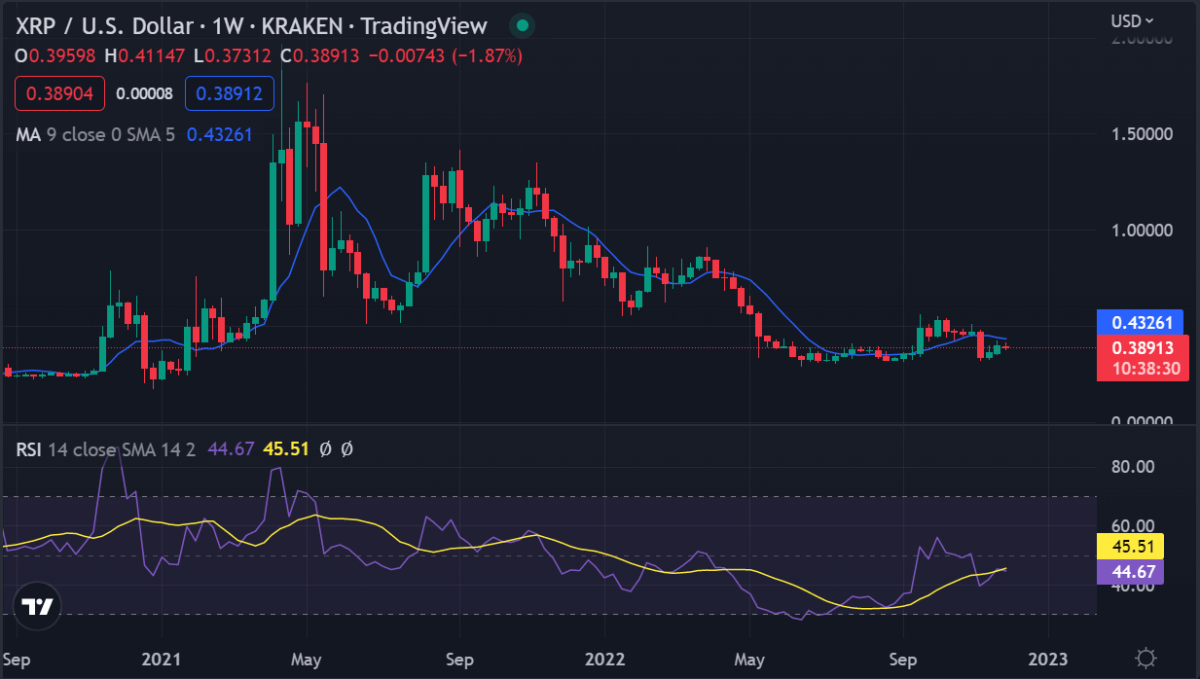
XRP’s weekly technical indicators show the RSI making higher lows, which indicates that a positive change in direction is likely.
The XRP/USDT pair has decreased below the 20-day EMA of $0.40, and now the bears will try to pull the price down further to $0.37. If they are successful, it is likely that the pair will stay inside its large range between $0.30 and $0.41 for a few more days.
Contrarily, if the cost improves from its present level of $0.37, it will propose buying on downward price movements. The bulls will then attempt to raise the price above the 50-day SMA of $0.43 and begin an upwards move to $0.51.
The Ichimoku cloud and the 50-period exponential moving average also show low bullish divergence but are not as clear as other coins. Overall, XRP looks most promising for a possible long position when it breaks past $0.4095.
BNB/USD
Binance coin price action shows a descending trendline after hitting a high of $314.1 on Nov 27th. It is currently trading at $290.23, which is still well above the support level of around $280.00
The weekly technical indicators show that BNB has been experiencing a bullish divergence for almost two months now. On December 2, the price dipped below the moving averages, and now bears are trying to pull the BNB/USD pair below $286. If successful, the pair could decline to $275 and then strong support at $258.
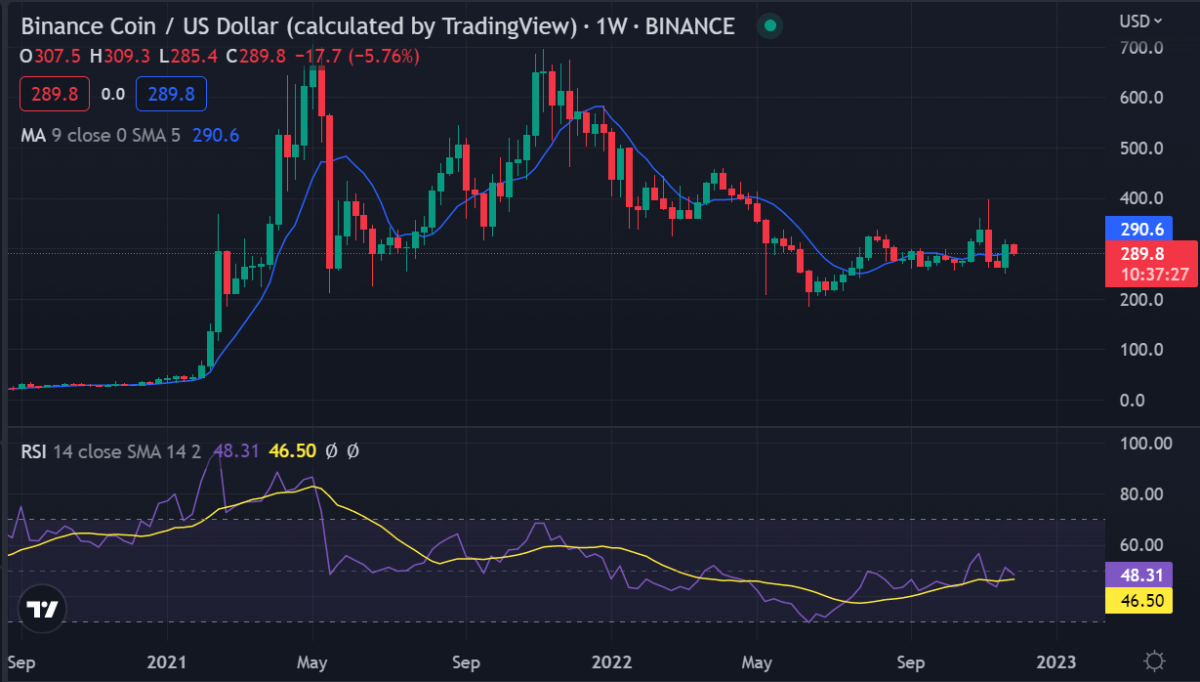
If the price rises from its current level and breaks above $306, it will suggest that buyers are attempting to regain control. The pair could then rally to $338.
The RSI shows low but improving divergence with the price which shows that a bullish trend is likely. That being said, the RSI has dropped below 50 despite the low divergence and may need to rebound above before we can see another upward price movement in BNB.
ADA/USD
Cardano has been on a continuous uptrend in the last 7 days, and its price is now trading at $0.3201. The ADA/USD pair hit a weekly high of $0.3254, but then quickly fell back to a support level of around $0.30.
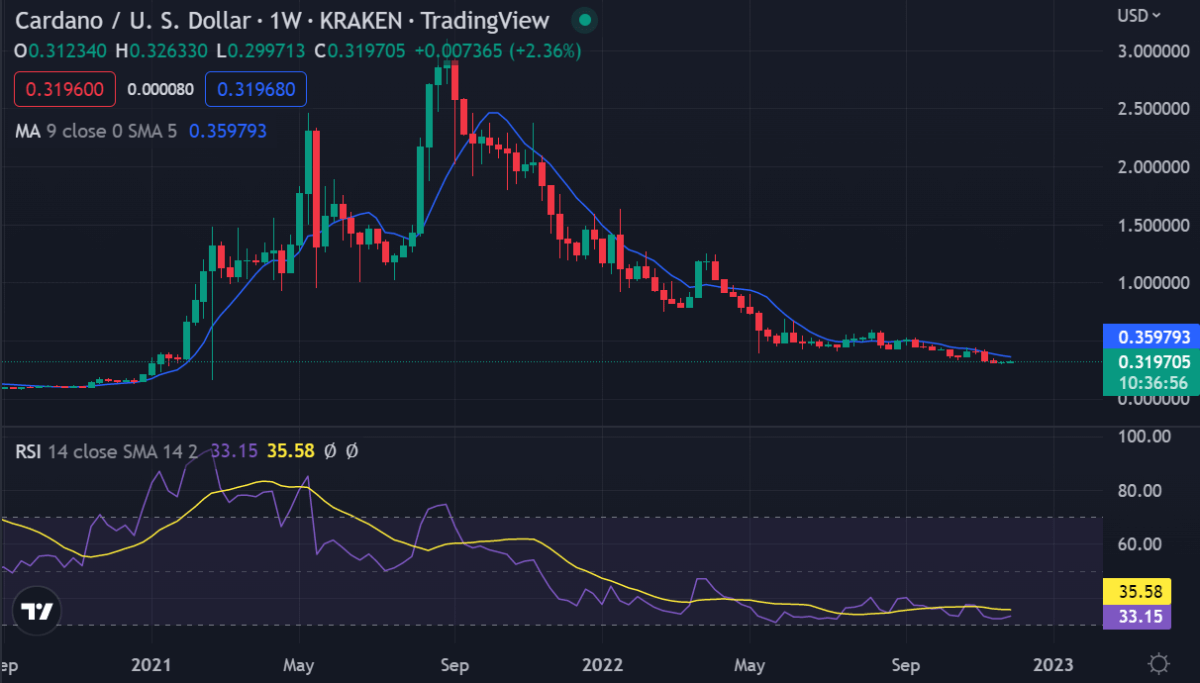
The weekly technical indicators show that the bulls are attempting to push the price higher above the 20-day EMA of $0.35. If they are successful, the pair may rally to around $0.425, where it will face a stiff resistance level. Thus it is recommended to wait on opening a long position until ADA breaks past $0.3320.
On the other hand, if bears succeed in breaking below their support level at $0.26, the price will likely drop to the next support level of $0.18. The RSI is also showing low divergence with the price action which means that a change in trend may be coming soon, but it is not clear whether ADA/USD will experience a bullish or bearish turnaround first. The bullish divergence on the RSI suggests that the selling pressure could be reduced and recovery may be on the cards.
DOGE/USD
Dogecoin is trading at $0.1033 after a week of horizontal trading in a tight range between $0.10 and $0.11. The coin is currently trading above the 20-day EMA, which could provide support if it has another dip closer to $0.10 on the downside.
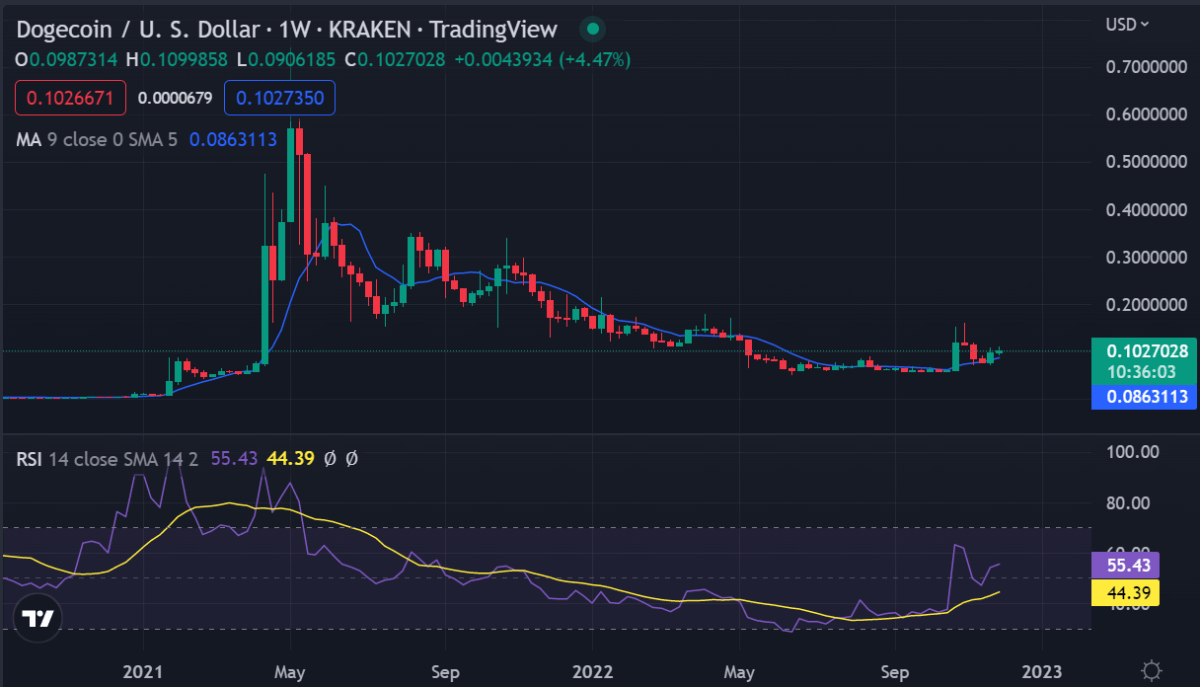
The weekly technical indicators show high but declining divergence in price action with the RSI indicating that DOGE/USD is likely to continue its sideways movement in the coming weeks. The price action has been trading inside a small range between $0.09979 and $0.1053, which could provide support levels on either side in case of a breakout or dip.
If the bears manage to pull the price below $0.10, it is likely to fall to $0.0935 and then a strong support level of around $0.081, which could provide an opportunity to open short positions. The RSI has also been heading lower with the price action for some time now and suggests that there is further room for DOGE/USD prices to continue moving downwards. However, in order for the price to fall, it needs to break below support at $0.0979, and then move past support levels at $0.09 and $0.088. On the other hand, a breakout above the resistance level at 0.1053 may see prices gain momentum, pushing the price towards higher resistance levels of around $0.11.
Weekly crypto price analysis conclusion
Our weekly crypto price analysis shows the overall market has shifted to a bearish sentiment after a short-lived bullish rally. The indicators and price action for the majority of cryptocurrencies are showing increasing selling pressure which could drag prices lower in the coming weeks. There is a reduction in buying power as well, but it is generally being played out at more stable levels like BTC/USD prices below $17,000. Additionally, traders may want to wait until there is a clear change in trend before opening any long positions. However, it is also possible that the market experiences another push higher before a bearish reversal takes hold.
Disclaimer. The information provided is not trading advice. Cryptopolitan.com holds no liability for any investments made based on the information provided on this page. We strongly recommend independent research and/or consultation with a qualified professional before making any investment decisions.


