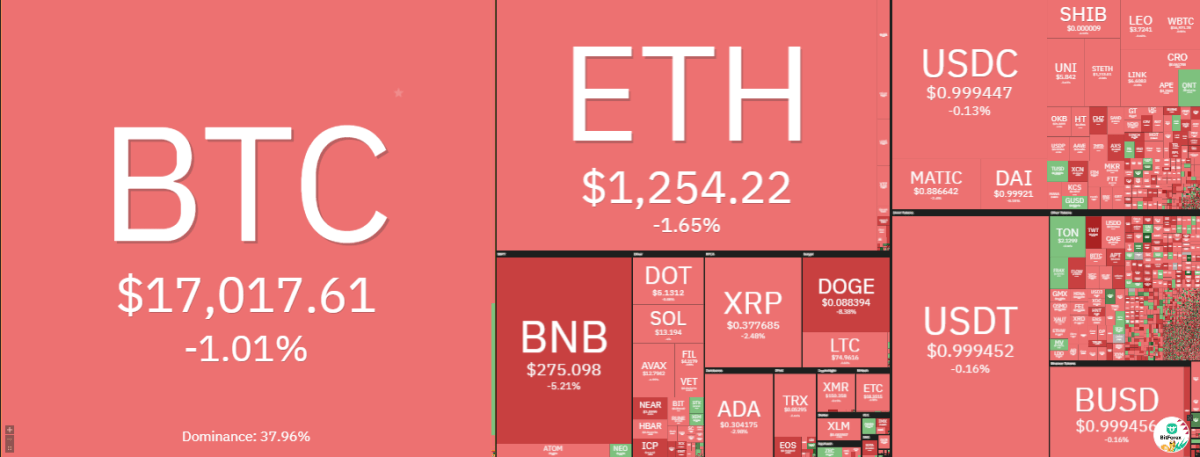
Ethereum price analysis reveals ETH is trading in a sluggish bearish trend as bulls stumble to sustain the key support level of $1,200.Most of the cryptocurrencies have been trading in the red zone, with Ethereum following the trend. Ethereum price has been trading in a range of $1,243.48-$1,281.78 in the last few hours and now ETH is yet to break this level. Ethereum is trading at $1,253.50, down by 1.61 percent in the last 24 hours.

Ethereum price analysis and technical indications suggest If the bulls fail to sustain support at $1,200, there will likely be more declines toward the $1,000 level. On the other hand, the ETH/USD pair still trades within a bullish trend above $1,100.Ethereum price may end up testing $1,200 in the short term if the bulls can clear the resistance at $1,275 and $1,300
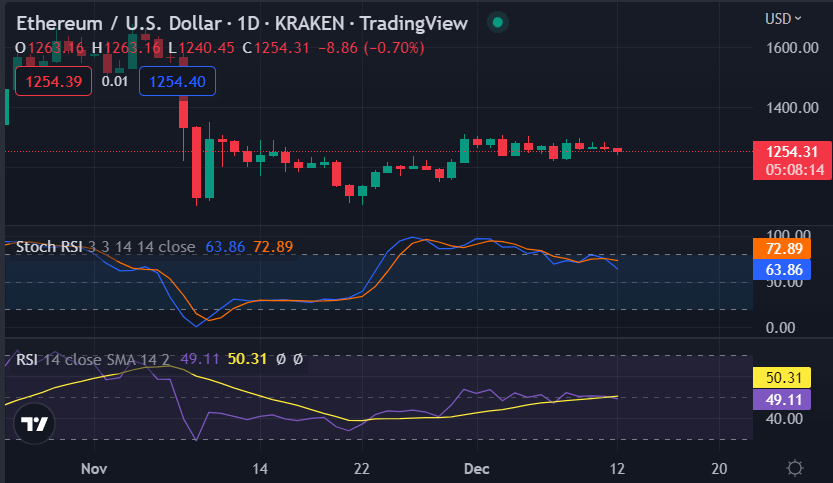
Ethereum price analysis on a 1-day chart: Bulls stumble to sustain key support of $1,200
ETH price is trading below a crucial resistance at $1,275 on the 1-day chart. The ETHUSD pair failed to sustain a strong bullish pressure above the trendline and 50 days EMA and started consolidating lower. On the downside, the 61.8% Fibonacci retracement level of the last wave from the $942.00 low to the $1,391.06 high is acting as a support area. Ethereum’s price needs to break the trendline resistance and clear the pivotal $1,275 level to resume its uptrend above $1,300 in the near term.

The Stochastic RSI on the 1-day chart is currently at 70, which indicates that the market has entered the overbought zone.
ETH price may rise towards $1,275 if it continues to correct higher from the current levels. On the downside, Ethereum price analysis show ETH should stay above $1,100 to avoid further losses in the short term.
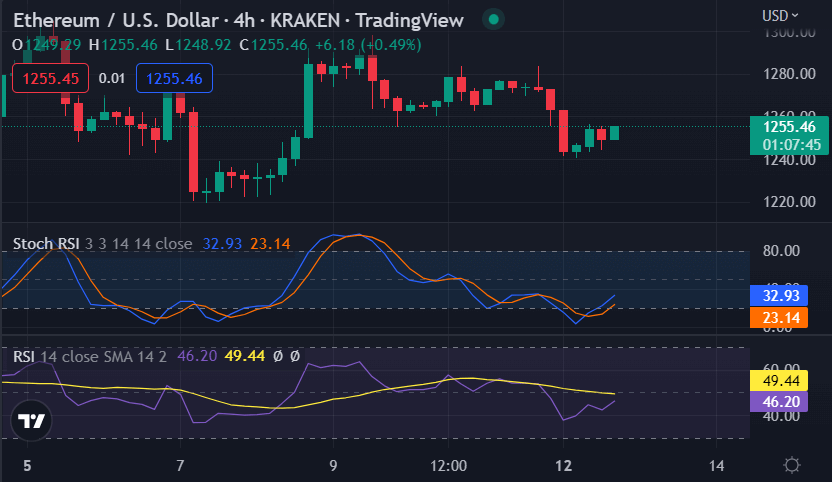
Ethereum price analysis on a 4-hour chart: ETH breaks out of an ascending channel that has been forming recently
Ethereum price analysis on a 4-hour chart indicates a bullish breakout of an ascending channel. Ethereum is currently trading in a bearish zone, but moderate buying interest was noted above $1,200.On the downside, the key support at $1,100 should hold losses if we take into account the last week’s trendline at $1,080.
The ascending channel is a well-known bearish reversal pattern and could result in a decline if the price fails to break back inside it in the coming days.

On the other hand, the price is facing a static resistance level of around $1300. If it breaks that level, the 0.5 and 0.618 Fib would be the next in line. These usually serve as powerful resistance in bearish trends and have the potential to halt the rally.
Ethereum price analysis if the bears break below $1,100 in the short term, it may probably decline toward $900.However, if ETH breaks past both the trendline and 50 days EMA at $1,220 it will be eyeing a rise toward its previous highs or higher toward $1,400.
Ethereum price analysis conclusion
Ethereum price analysis for today is bearish and ETH is yet to break the key resistance of $1,200 if the current bear market prevails. On the upside, ETH price needs to break above $1,275 and $1,300 to rise further in the near term.
While waiting for Ethereum to move further, see our articles on Siacoin wallet, Pi Wallet, and LTC Wallet Review.


