According to the current Aptos price analysis, the coin seems to be under consolidation, with bearish pressure clearly visible. The price has slightly decreased to $10.36, and more deficits may follow during the day. Though APT is no stranger to bearish pressure, a contributing factor could be the unlocking of $50 million worth of tokens last week, which triggered the bearish sentiment. However, the coin has been trading in a very narrow range since April 22, 2023, which hints at the possibility that the coin is consolidating once more.
A surge in APT price was also observed on April 14, 2023, when Elon Musk tweeted, “AP APT OTT!” The tweet caused a more than seven percent surge in price in only one minute, as APT in this tweet was wrongly taken for Aptos token (APT), instead in this context it meant to be Advances persistent threats; however, the entire gain was swept off after Musk deleted the tweet.
APT/USD 1-day price chart: APT to correct more
The one-day Aptos price analysis confirms that chances of recovery are postponed for today. The bears have been dominating the price charts for the past week as more selling activity occurred. Some bullish efforts were seen yesterday as the token price recovered, but today, resistance from the bearish side came again. The price has slightly corrected to $10.36, and there is a chance that it may go down by more than three percent today if selling pressure persists. The token is already down by 17.40 percent for the past week.

The price is trading below its moving average (MA) value, which is $10.74, and recently the MA moved below the SMA 50, which is a bearish indication. As the price has been undergoing a continuous decline for the past few weeks, the Bollinger Bands average has dropped to $11.36. The Bollinger Bands Indicator’s upper and lower values are as follows: its upper end is standing at $13.16, which represents the highest resistance, and its lower back is at $9.55, which represents support. After today’s correction, the Relative Strength Index (RSI) score is currently 39, but the consolidation has prevented the indicator from displaying any distinct signals.
Aptos price analysis: Recent developments and further technical indications
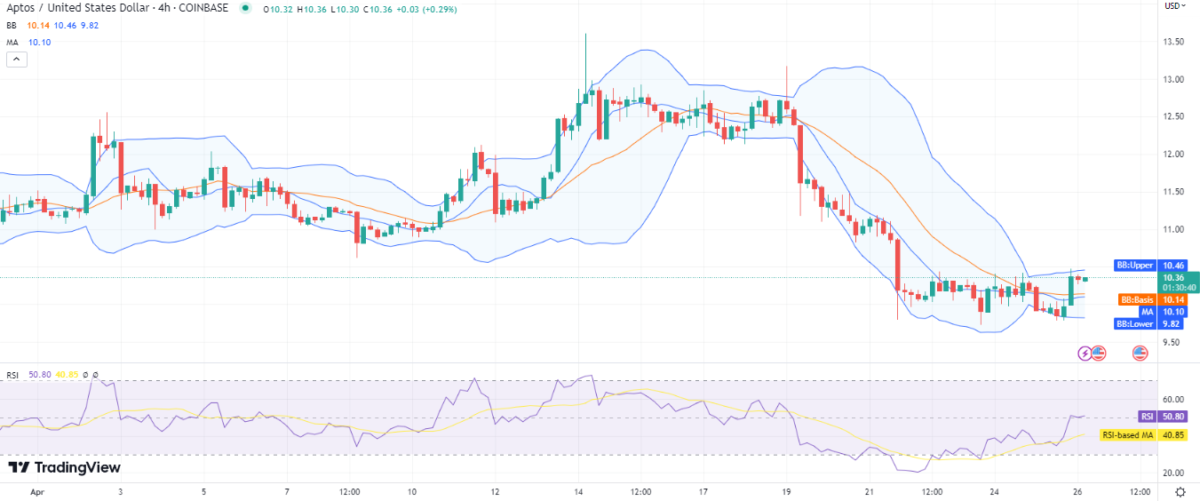
The four-hour Aptos price analysis predicts a bearish trend as a slight decline in APT/USD market value can be detected. Although the bulls are trying to elevate the price level at the moment, the bears are still in a more dominant position. The price is now settling down at $10.36, and at the same time, the moving average value at present is $10.10 below the SMA 50.

The volatility is increasing on the 4-hour chart, which means there is a high probability that the price oscillations may increase. The Bollinger Bands Indicator’s upper and lower bounds are, respectively, $10.46 and $9.82. The RSI score is now 50, which is quite a neutral figure.
Aptos price analysis: Conclusion
The one-day and four-hour Aptos price analysis is predicting a downward trend for the day as the price moved in a downward direction. Red candlesticks indicate a loss for the purchasers as the price has dropped to $10.36. In the upcoming weeks, we can expect a rise in price if the current consolidation takes an upward breakout, with buyers returning to the market. However, under current circumstances, most of the technical indicators are hinting at the possibility of the price going down.


