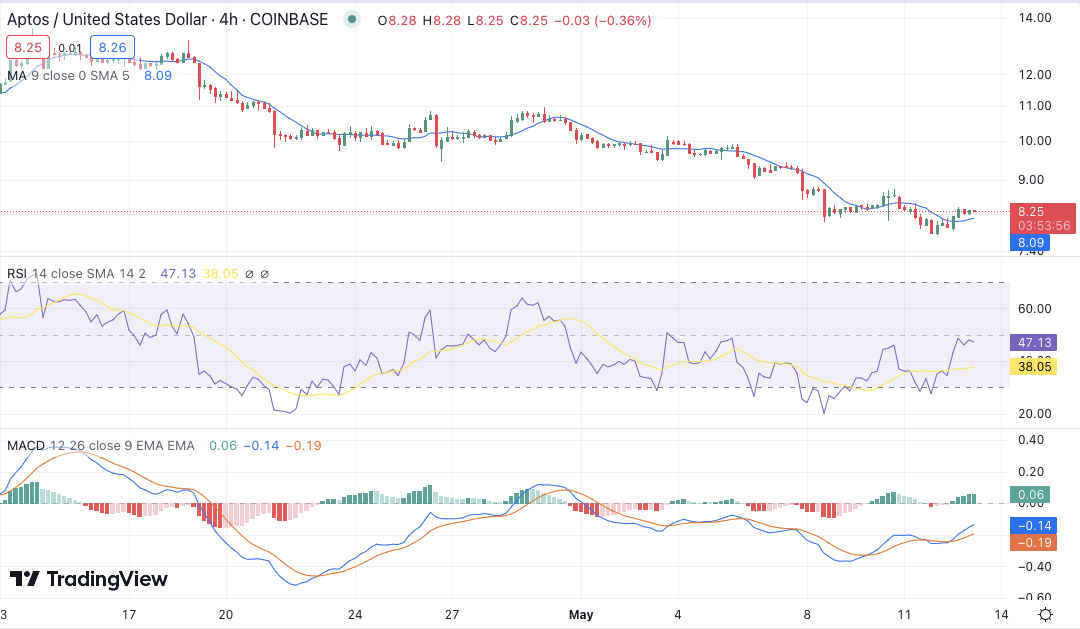
The Aptos price analysis is on the bullish side as it is showing a slight improvement in the price today, as the price has slightly improved up to the $8.25 level. The price movement has been in a quite narrow range, but the downtrend has been halted for now, and the bulls are trying to take advantage of this.
The bearish touched the $7.79 level, which acted as strong support for APT, and after briefly testing this level, we have seen an uptrend emerge in the asset’s price. The resistance is present at $8.32, and if it can be broken above that mark, then we could see more bullish sentiment taking shape.
Aptos price analysis 1-day chart: Bulls pursue $8.50 as their next target
The 1-day Aptos price analysis indicates a slow bullish momentum. However, the bulls have been dominating the market as they have caused a further increase in the price today. The bulls have taken the price to $8.25, and now the coin shows a 3.48 percent increase in price over the last 24 hours. The bullish and the bearish forces have been in balance, but the bullish sentiment has been more prominent lately.

The 9-EMA is above the 20-EMA, indicating that the bulls are in control of the current situation. The moving average indicator is currently at $8.69, with a 50-day moving average standing at $8.27. The MACD is also reflecting a further increase in price as it shows a bullish crossover. The signal line (orange) is above the MACD line (blue), which seems to be favoring the bulls. The Relative Strength Index (RSI) shows a bullish outlook as it is at 32.27 and rising, which suggests that the coin has more room to grow in the near future.
Aptos price analysis: Recent developments and further technical indications
The 4-hour price chart for Aptos price analysis is giving out a bullish signal as well, as the bulls have ruled the price charts for the past few hours consecutively, even though the price has not shown any major increase. The green candles have been prevailing in the market, and we can expect to see more of them if there remains a strong bullish sentiment.

The MACD indicates that the bulls are still in control as it shows a sustained bullish crossover, which will only gain momentum if the $8.50 mark is broken. The MACD line at -.14 is above the signal line at -0.19, indicating that the bulls remain in control. The RSI indicator is also favoring a bullish outcome as it stands at 47.13 in the neutral zone, retracing from the overbought region. The moving average indicator is also reflecting a bullish outlook as it shows the 50-day moving average crossing above the 200-day moving average.
Aptos price analysis conclusion
The Aptos price analysis is bullish for today as bulls have further increased the cryptocurrency’s price. The most recent price trend line is forming upwards, and a further increase in price level above $8.25 could be seen in the near future if the bulls remain in control. The technical indicators are also favoring a bullish outlook, as all of them are giving out positive signs for Aptos. The $8.32 resistance level will be an important milestone for the asset, and a breakthrough of the same could take it to even higher levels.


