Today, the Arbitrum price analysis is very positive. The token price has increased significantly as it rushes back toward $1.22, but the next few hours will determine if it will overcome the resistance or stall out before that. If ARB crosses above this immediate obstacle, the second layer of resistance is present at the $1.24 level. There is fairly strong support at $1.17, followed by another level at $1.10. The price fluctuated slowly over the previous two days, but today’s sharp increase in price has accelerated the positive momentum once more.
ARB/USD 1-day price chart: Bullish momentum accelerates along
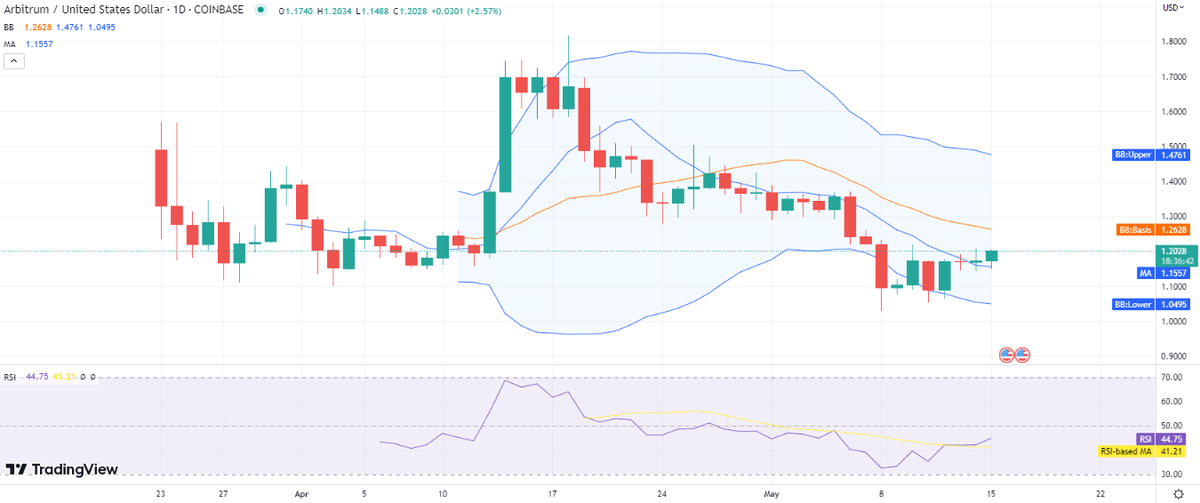
The Arbitrum 1-day price chart shows that the token price is increasing steadily and quickly; it began rising at $1.17 today and is currently trading at $1.20 as of this writing. As this pronounced bullish trend was noticed, the token’s price increased by almost three percent during the previous 24 hours and by 2.50 percent over the previous seven days. Over the past 24 hours, the trading volume has climbed by more than 11 percent, giving the coin a 0.13 percent market dominance.

The Bollinger bands currently have an average at the $1.26 mark, above the price level, acting as resistance for the token price function. The upper band is present at $1.47, while the lower band is present at the $1.04 mark, indicating strong volatility.
Similarly, the relative strength index (RSI) is moving upward. As the curve gets closer to the center line at index 44, the indicator, which is now in the neutral zone, shows increased purchasing.
Arbitrum price analysis: Latest developments and further technical indications
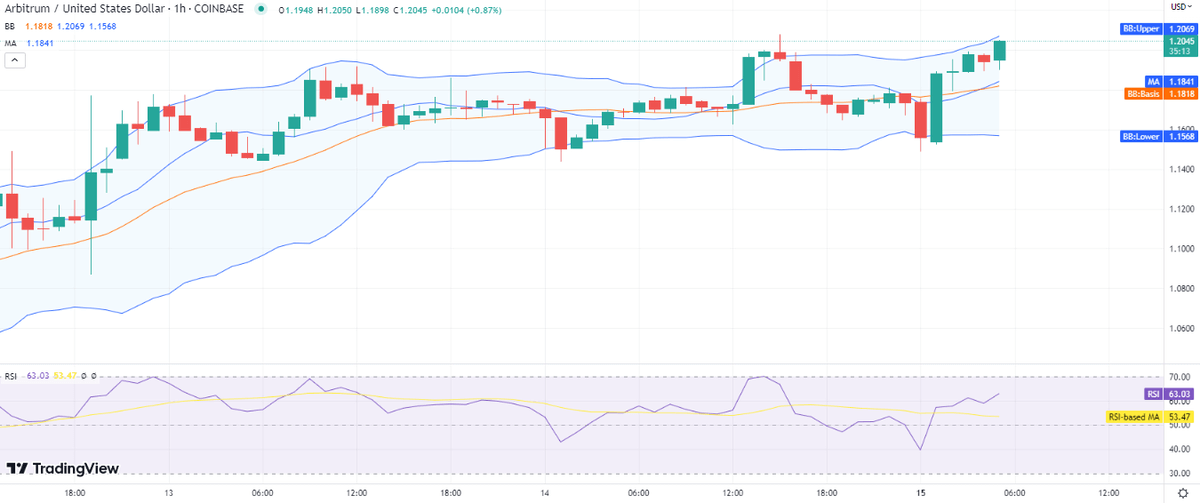
The bulls have recovered momentum, and the 4-hour Arbitrum price analysis anticipates a sustained rise in the price. The price has risen to $1.20, which is unexpected given that the price oscillations were previously slow and that a swing low of $1.14 was also seen at the beginning of the trading session. However, the coin later in the morning began displaying aggressive bullish behavior, and it has been racing high for the past eight hours.
On the 4-hour chart, the price is getting close to the upper Bollinger band, which is present at $1.22 just above the price level. If this resistance holds strong, traders can anticipate a correction in the hours ahead. The RSI has reached the index of 60 but displays a flattening curve; however, if the price breaks through the barrier, it may rise once more.
Arbitrum price analysis conclusion

The price may rise much more, breaking through the $1.22 barrier, according to the Arbitrum price analysis. As the coin’s price approaches the resistance zone, a minor reversal is also possible for a few hours, after which bulls may begin pushing prices higher.


