Avalanche price analysis suggests a bearish trend for today and supports sellers as the price has undergone a considerable decrease since morning. Although the bulls were in the winning position yesterday, a downtrend has been following for the last few hours, and the recent progress is in favor of the bears as the price declined to the $15.63 level today. The resistance for the AVAX/USD pair is at the $17.07 level and a break above this level may lead to further movement on the upside. The support for AVAX/USD is present at $15.38 and a break below this level may cause a dip in price.
Avalanche price analysis 1-day chart
The 1-day Avalanche price analysis shows bears are trending for today and forming red candlesticks. The AVAX/USD pair has lost a 7.93 percent value over this time period. The price is now at $15.63 at the time of writing, and further devaluation will follow if the selling activity experiences a further rise. The volatility is high, which is why the Bollinger band average is now at $16.398, whereas the upper Bollinger bands value is at $18.663, representing the resistance for AVAX, and the lower Bollinger bands value is at the $14.133 position representing support for the coin price.

The moving average convergence and divergence (MACD) indicator shows that the MACD line is currently below the signal line signaling a developing bearish retracement. The Relative Strength Index (RSI) is trading at a downward slope at index 39.38 in the lower half of the neutral zone due to the price sinkage as selling activity continues in the market.
AVAX/USD 4-hour price chart: Latest development
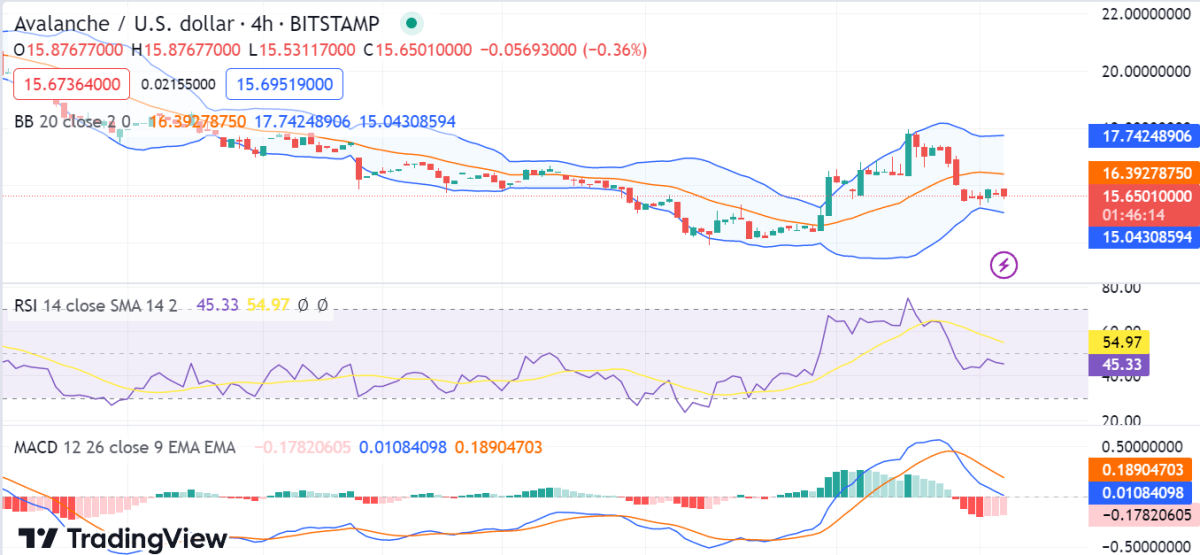
Avalanche price analysis in a 4-hour price chart shows that the market is in a bearish trend as prices move downward. The bearish trend is expected to continue in the market as the selling pressure remains high in the market currently. The price for AVAX/USD pair has declined by 7.93 percent in the last 24 hours. A trading volume of $289 million and a total market cap of $5.11 billion has been attained by the altcoin.

The MACD line is below the signal line, suggesting that The MACD is also bearish, with a negative divergence forming. The upper band of the Bollinger band indicator is at $17.742, representing the strongest resistance, on the other hand, the lower band is at $15.043. The relative strength index (RSI) is currently at 54.97, signaling that the market is neither overbought nor oversold.
Avalanche price analysis conclusion
In conclusion, the Avalanche price analysis demonstrates that the currency is correcting today and might be in a downtrend for the rest of the day as the bears try to drive the prices below $15.63. The $17.07 level is proving to be a barrier for the Avalanche pricing, which is currently at $15.38. But, as long as the adverse winds blow, the market indications indicate further downside momentum in the near future. With the current economic situation, investors continue to be cautious. If there is further selling pressure, prices will keep dropping.


