
Avalanche price analysis is showing signs of a downtrend, as the price has been following a decreasing movement for the last 24 hours. The bears have been in control of the market, pushing the price down from $17.60 to a current low of $17.54. The resistance level at $17.72 has caused some bearish pressure, making it difficult for bulls to push through this level. The high selling activity is causing the price to downgrade further, and a break below $17.46 could signal an even lower movement for Avalanche in the near future. AVAX reveals the price has been following a descending channel for a while. The bears are in control of the market and are likely to push prices lower in the next few hours.
Avalanche price analysis 1-day chart: Bears drag price levels down to $17.54
The 1-day Avalanche price analysis shows that a drop in the price of AVAX could be imminent, as the bears are currently in control of this market. The bears have pushed the price down to a low of $17.54, which is below its resistance level of $17.72. If the bearish pressure persists, we could see prices sliding even lower as selling activity remains high. Bulls must be quick to break through the resistance level or otherwise face seeing prices drop further.
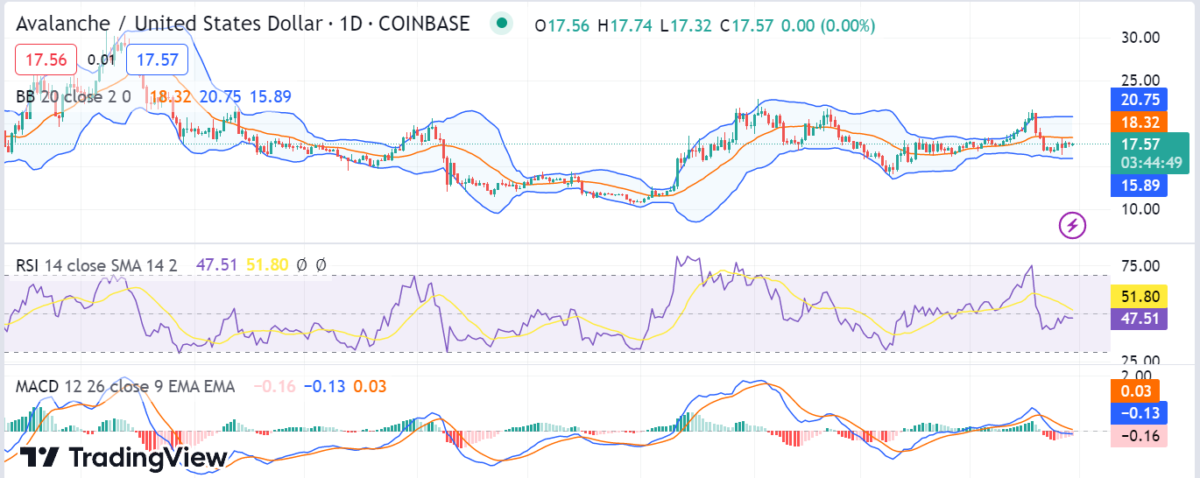
The relative strength index (RSI) indicator is also below 50, indicating that the market is oversold and could soon enter a corrective phase. The MACD is still bearish and has yet to cross into positive territory, which suggests that the bears are in control of the market. If the current bearish trend continues, Avalanche could soon test the $17.46 support level and may even fall further in the near term. The upper Bollinger band value is now $20.75, whereas the lower Bollinger band value is at $15.89.
AVAX/USD 4-hour price chart: Recent updates
The 4-hour Avalanche price analysis also that the downtrend is still in play and there is a high chance of the AVAX/USD pair falling further in the near term. The bearish pressure is increasing and could cause prices to drop even further if bulls fail to break through the resistance level at $17.72.The market volatility is also low, which suggests that the market is currently in a consolidation phase and could soon enter a new trend. The upper Bollinger band value is now $17.97, whereas the lower Bollinger band value is $17.07.
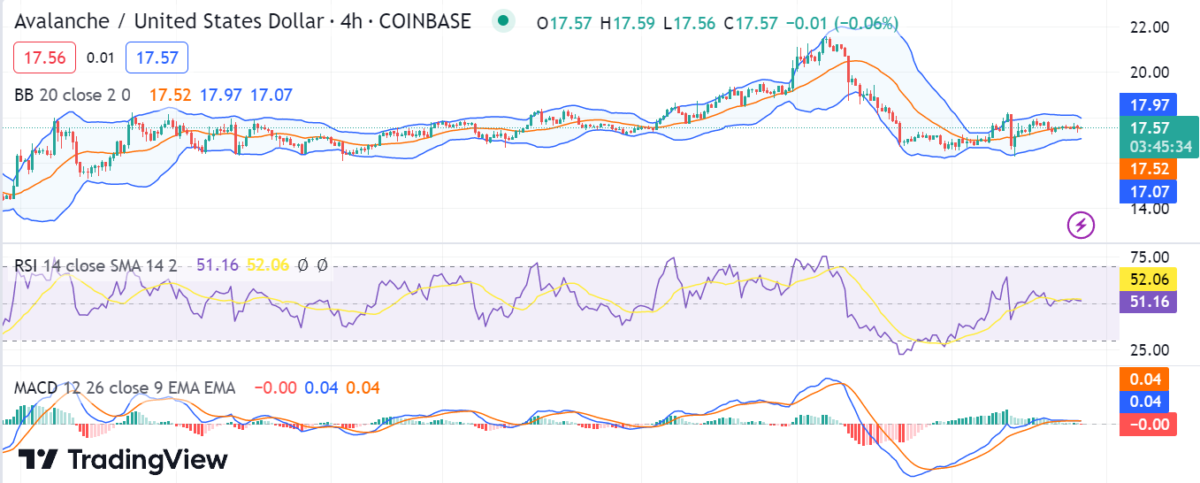
The technical analysis of Avalanche suggests that the price is likely to remain bearish in the near term; however, there may be possibilities for a short-term recovery. The relative strength index (RSI) indicator is currently at 51.16, which indicates that the market is neither overbought nor oversold. Moreover, the MACD shows a bearish trend and has crossed into negative territory, indicating that the bears are in control of the market.
Avalanche price analysis
Overall, Avalanche price analysis is currently experiencing a downward price trend and could continue to decrease if bulls fail to break through its resistance level. The bears could soon drag prices further down if the bearish pressure persists. Traders should be cautious when entering this market, as prices could dip even lower in the next few hours or days.


