Dogecoin price analysis for today shows DOGE is currently stuck in a consolidation phase around the $0.07493 mark. This comes after the currency saw a sharp drop in value from its all-time high of $0.770 on March 23rd. Despite the recent price drop, Dogecoin remains one of the most popular cryptocurrencies on the market. The resistance for the DOGE/USD pair is currently seen at the $0.07677 level, but the bearish sentiment in the market is making it difficult for buyers to break past this level. On the downside, there is strong support near $0.07339, and if the price drops below this level, it could see further losses. The 24-hour trading volume has also declined by over 33.91% and is now at $408 million, while the market cap is currently at $9.94 billion.
Dogecoin price analysis 1-day chart: DOGE devalues up to $0.07493 after facing a loss
The 1-day Dogecoin price analysis shows that the coin is currently in bearish market sentiment. The market decline shifted to the bearish side after Dogecoin failed to break the $0.07677 resistance level, and further devaluation is to follow if the selling activity experiences a further rise. Moving on toward the moving average (MA) value, which is $0.0750, for a one-day price chart.
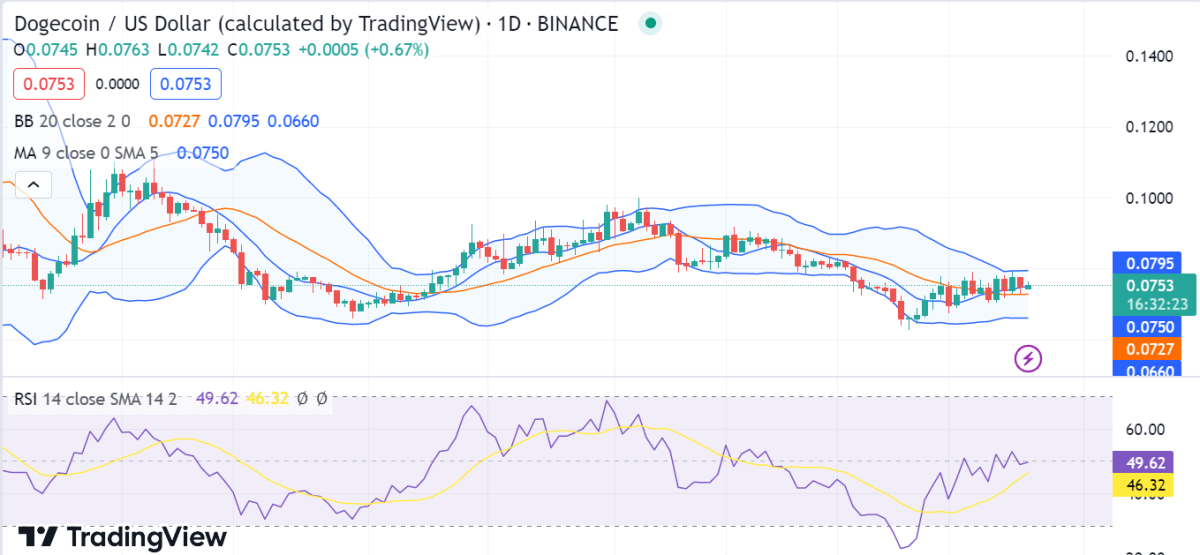
Volatility is increasing, which is a relatively negative indicator of future market trends. The upper Bollinger band value is now $0.0795, whereas the lower Bollinger band value is $0.0660. The relative strength index (RSI) indicator is currently trading at 49.62 and heading toward oversold territory, which is another sign that prices are likely to fall further in the short term.
DOGE/USD 4-hour price chart: Recent updates
The hourly Dogecoin price chart indicates that the coin is trading inside a descending triangle pattern. The price is facing strong rejection near the $0.07677 resistance level, and as long as this holds true, further drops are expected. The digital asset has lost nearly 2.25 percent of its value in the last 24 hours, and it remains to be seen if the bulls can turn things around. The moving average lines are also in favor of the bears as the 100 SMA is below the 200 SMA in a bearish alignment.
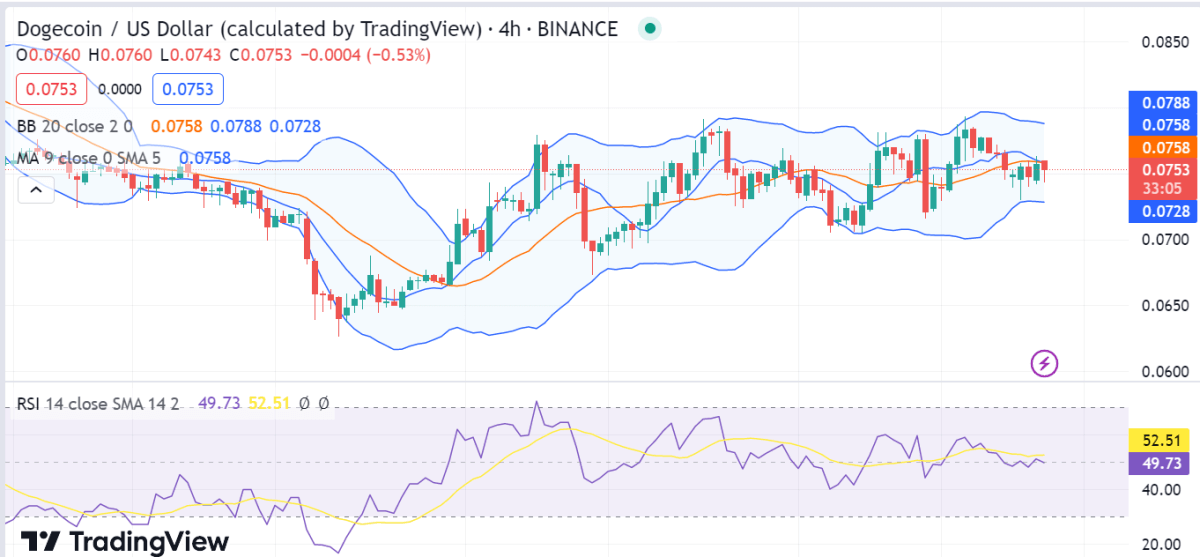
The technical indicators are still bearish, including the RSI, which is heading below the 50.00 level. The relative strength index (RSI) indicator is currently trading at 49.73 and heading toward oversold territory, which is another sign that prices are likely to fall further in the short term. The Bollinger Band width is also contracting, which could be an indication that the coin might soon experience a breakout.
Dogecoin price analysis conclusion
In conclusion, the Dogecoin price analysis suggests that the coin is likely to break down if the bears maintain their current momentum and the selling pressure remains strong. The bears are struggling to maintain a high momentum and have succeeded in causing a decline in the price to the $0.07493 range. However, a price recovery could be possible if the bulls can build enough momentum in the coming days.