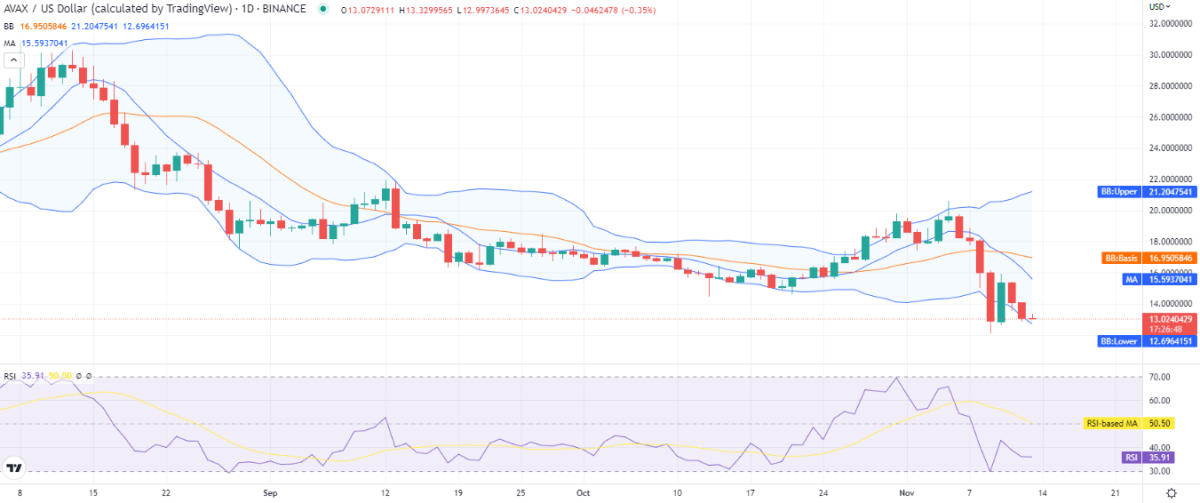
The Avalanche price analysis shows a bearish daily trend. The bears have taken over the market again after a bullish start observed by the coin, but now, the trend is again shifting towards the bearish side. The price has decreased considerably during the last four hours and has now reached the $13.02 mark. The past few hours have been highly discouraging for buyers as the bears are extending their influence.
AVAX/USD 1-day price chart: Bears divert the trend after a bullish start
The price curve on the 1-day Avalanche price chart is bearish, which is discouraging for buyers.The price deficit has been increasing during the day, dragging it down to the $13.02 level, reporting a slight loss of 1.09 percent for the last 24 hours. The crypto pair is also down 32 percent for the past week, as the price trend line has been downward for the last seven days. The trading volume has decreased by 57 percent, and the market dominance has been recorded at 0.46 percent for AVAX/USD.

The moving average (MA) value, which is present at $15.5, has crossed below the SMA 50 curve, which is due to the great bearish momentum. In comparison, the Bollinger bands average is still at a higher height as it holds up at the $16.9 mark.
The volatility in the price chart is increasing, as the Bollinger bands are widening, with the upper band present at the $21.2 mark representing resistance and the lower band at the $12.6 mark representing the strongest support for the coin. The Relative Strength Index (RSI) shows movement downwards as the score is now 35 and is expected to go lower than these levels as well due to the selling activity currently taking place in the market.
Avalanche price analysis: Recent developments and further technical indications
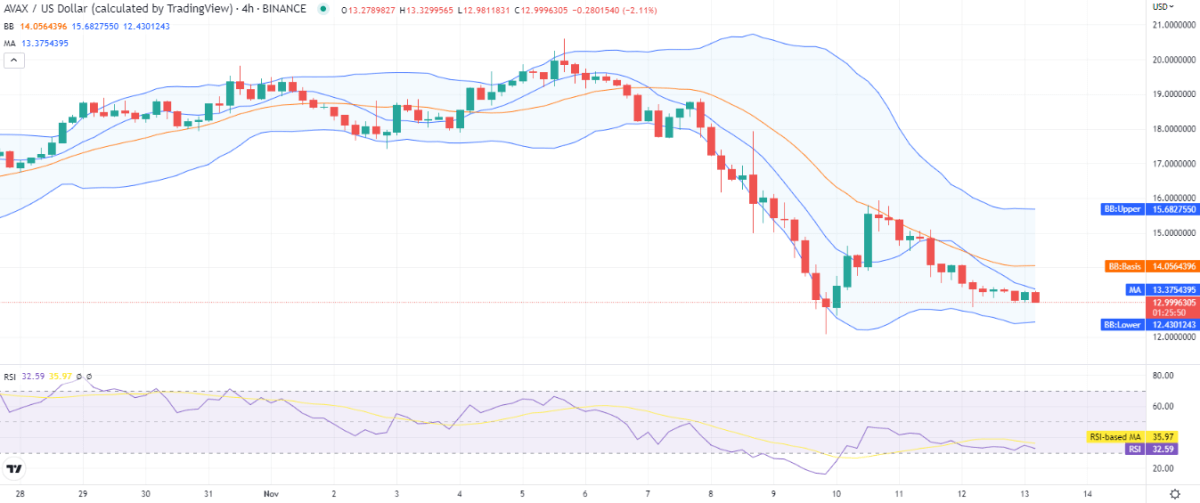
The 4-hour Avalanche price analysis suggests the bearish direction for the cryptocurrency and is properly represented by the price, which continues to decrease as the price, after breaking upwards, has deflected in the lower direction, and the price has decreased to $12.99 during the last four hours. As the volatility is high, it may provide more room for downward price movement.

The Bollinger bands show the $14 average, while the lower value is present at $12.4, and the upper value is 15.6. The RSI levels are also seeping downward, and the downwards curve has brought the score to index 32 for the 4-hour price chart, which is near the border line of the undersold zone.
Avalanche price analysis conclusion
The latest Avalanche price analysis shows the price is going down once again. The AVAX/USD price has decreased to $12.99 at the time of writing and is expected to decrease further in value in the short term as well, as the bears have overwhelmed the market and reversed the bullish efforts observed at the start of the trading session.
Disclaimer. The information provided is not trading advice. Cryptopolitan.com holds no liability for any investments made based on the information provided on this page. We strongly recommend independent research and/or consultation with a qualified professional before making any investment decisions.


