
With a few brief retraces of the bullish momentum here and there, the Avalanche price analysis is presently leaning bearish. The price has dropped to $16.78 as a result of the bearish progress. If the price reaches $16.65 and maintains its current growth momentum, the support levels can be easily passed. Bullish support was also present over the previous few days, but the pattern today has been against the bulls.
AVAX/USD 1-day price chart: Losses occur as the price of AVAX drops below $17
The 1-day price chart for the Avalanche price analysis reveals that the cryptocurrency market is presently moving in a bearish direction as the price levels are steadily declining. As the price dropped to $16.78, the trend today has remained consistent with that of the previous few days: it is highly bearish.
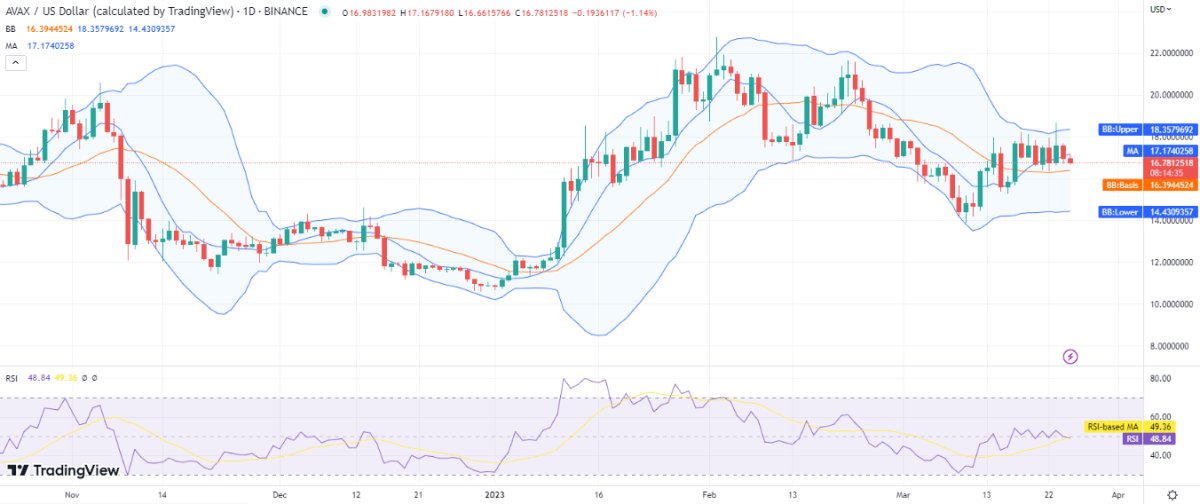
When compared to the moving average (MA) number, which is the calculated mean of all price values and equals $17.17, this is noticeably low. The Bollinger band has an average value of $16.29 and the volatility is rising, which is typically a bad indication keeping in mind the current situation.
The upper band of the Bollinger bands is present at $18.35, which represents resistance, and the lower band is present at $14.43, which represents support. The Relative Strength Index (RSI) number is also continuously dropping; it is currently 48, which is a neutral value.
Avalanche price analysis: Recent developments and further technical indications
The 52-hour period covered by the 4-hour chart for Avalanche price analysis has seen a steady drop in price. Although there have been unsuccessful bullish efforts during this period as well, the most recent update is moving in a bearish direction.
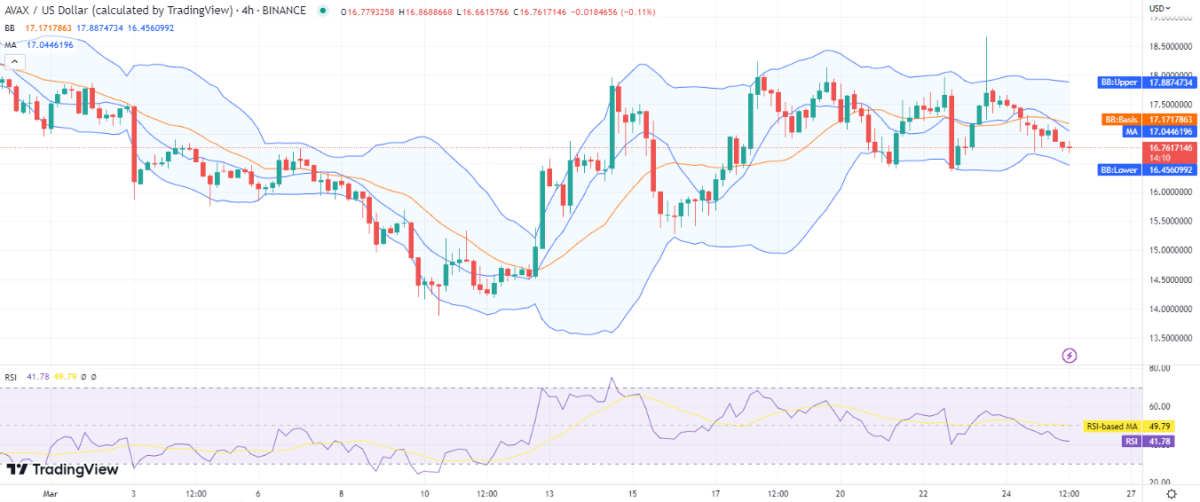
The coin’s worth has decreased to about $16.76 and is anticipated to decline further. The price has, however, also hit local support at the present level, which could serve as a cushion. The upper Bollinger band has achieved a value of $17.88, while the lower Bollinger band has reached a value of $16.45. The level of volatility is rising. The moving average is presently showing $17.04 in value and is relatively higher in level. On the other hand, the RSI score, which is presently at 41, is also dropping hourly.
Avalanche price analysis conclusion
The 1-day and 4-hour price charts for the Avalanche price analysis indicate that the trends are clearly bearish, with the bulls showing the least amount of power. As more sellers join the market, the price has gradually dropped up to $16.76. The $16.52 support level may or may not be passed despite the fact that there is only a slight difference between the current price and the support. Additionally, sellers are anticipated to trade their possessions in order to offset potential losses.


