As the coin continues to rise after reaching a peak yesterday, the Avalanche price analysis is positive today. The coin price has broken above the resistance level at $21.11 because this was a critical resistance zone, and as a result, it is currently reaching $21.85. The price action is continuously moving upward.
AVAX/USD is expected to reach new highs later today and test the resistance level at $22.95 again since there are excellent chances for bulls to maintain their advantage. The bullish momentum has been quite constant since yesterday.
AVAX/USD 1-day price chart: Bulls get aggressive as price trades higher
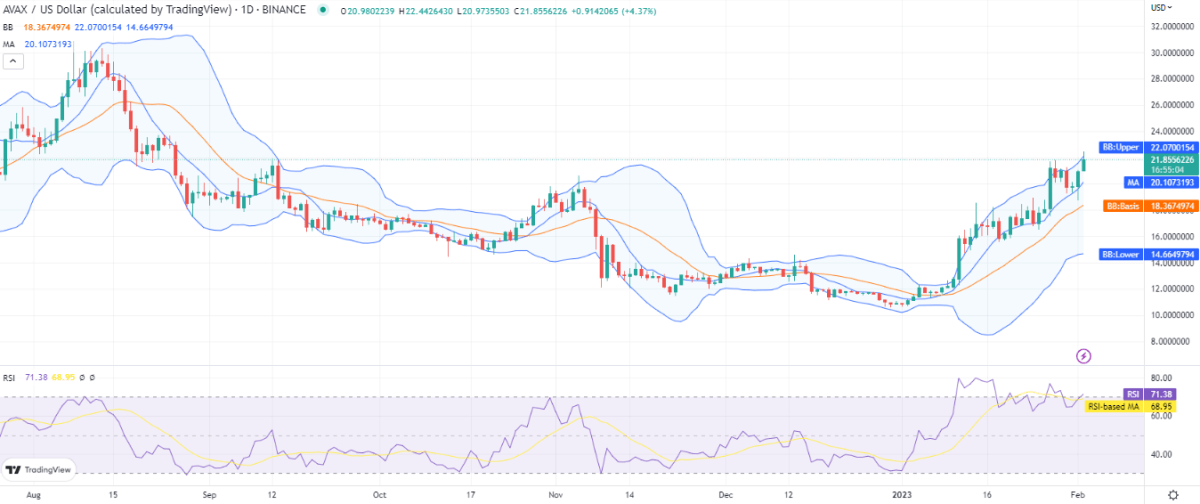
The price has grown today, according to the 1-day Avalanche price analysis, as the price function is continuously heading upward. AVAX is presently worth $21.85 in the market. Over the last day, it increased in value by about 13.45%, while over the previous seven days, it increased in value by around 19.60% as a result of a strong bullish trend that the market experienced on particular days. But starting yesterday, the AVAX/USD pair was able to overcome the bearish resistance, and the bulls are currently heading for the $22.95 target. On the other hand, over the past year, the market cap has climbed by 13.35 percent, while the AVAX/USD trading volume has increased by 98.36 percent.

As the Bollinger bands expand, the volatility is significant right now and is slowly rising. The indicator’s mean average is visible at the $18.3 mark below the price level, and its upper and lower limits, which indicate support and resistance for AVAX respectively, are located at $22.07 and $14.66 respectively.
At an index of 71, the relative strength index (RSI) is currently trading in overbought zone. The price function is dominated by bulls, and the indicator is displaying intense market purchasing activity by presenting an upward RSI curve.
Avalanche price analysis: Recent developments and further technical indications
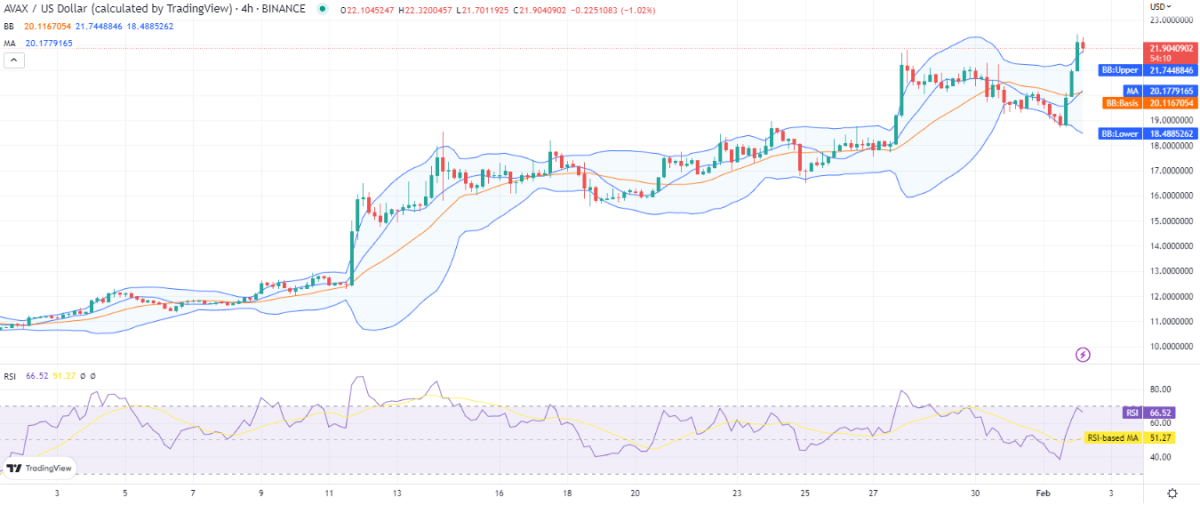
The price movement is sharply upward from yesterday, according to the 4-hour Avalanche price analysis, as the trends have shifted in favour of the bulls. The cryptocurrency pair made good strides yesterday, and today is no different. However, over the past four hours, the price function has been moving downward, suggesting that the bulls may already be worn out.

The Bollinger bands’ coverage of more of the price chart’s 4-hour time frame indicates that volatility has been rising. The AVAX/USD pair currently has its first layer of support at the upper band, which is $21.74. The strongest support is seen at the lower band of the indicator, which is $18.48.
After following a sharp upward trajectory, the RSI turned lower and has since stepped down to index 66, suggesting that there has been selling activity. The moving average is now trading at $20.17. Due to the prior strong bullish trend, the SMA 20 curve is crossing over the SMA 50 curve.
Avalanche price analysis conclusion
Given that the price function has been moving upward, the Avalanche price analysis is very positive for today. Although the price of coins is currently correcting, the overall trend is bullish, and the bullish momentum is strong, which is also demonstrated by the price movement of today. As a result, we anticipate that in the coming hours, the AVAX/USD will continue to rise and attempt to overcome the resistance located at the $22.95 level.


