The most recent Avalanche price analysis predicts a bearish trend for the cryptocurrency as it underwent devaluation in the last 24 hours. The bearish wave is getting stronger as the selling momentum intensifies with time. The downward curve is expected to extend in the upcoming hours as well as the price is drawing closer to the support level. The AVAX/USD value displayed in the one-day price chart is $15.57.
AVAX/USD 1-day price chart: Bearish wave extends after a brief interval
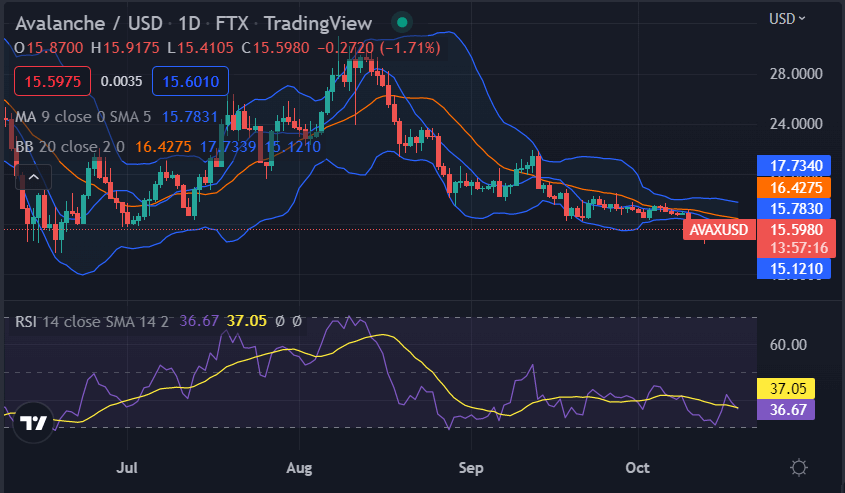
The one-day Avalanche price analysis shows that a bearish trend currently controls the market as a loss in coin value is observed. The price underwent recovery at the start of the week, but now the declining trend is getting quite stronger. The short-term trending line is again moving in the descending direction, and the AVAX/USD value is now standing at $15.57 and it is down by 3.03% at the time of writing. The price is now lower than its moving average (MA), i.e., $15.78.

The area between the Bollinger bands is increasing, suggesting that further downtrends are coming ahead as the volatility increases. The upper band of the Bollinger bands indicator is touching the $16.42 point, whereas their lower band is present at a $15.12 margin. The Relative Strength Index (RSI) graph shows a downward curve as the score dropped up to 37.05.
Avalanche price analysis on 4-hour chart: Bearish trend likely to continue
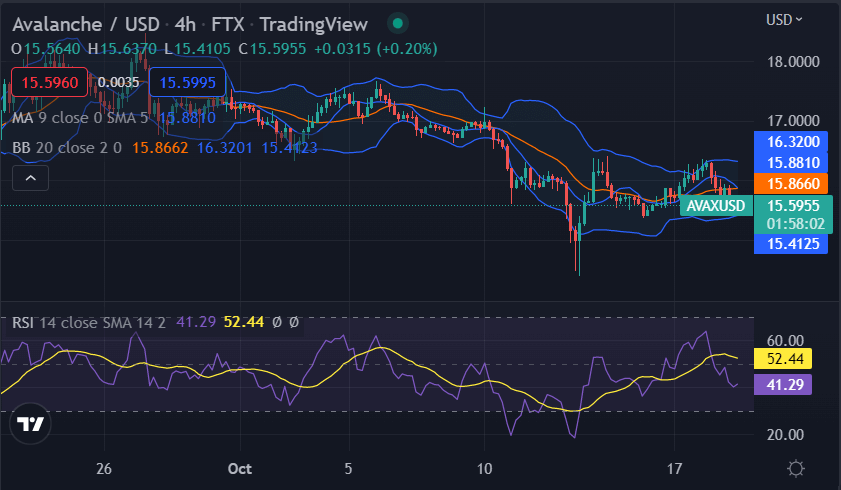
The 4-hour Avalanche price analysis shows that the price is going down again after a brief escape. The bears are pulling down the price levels, and currently, they have reached the $15.57 level. The moving average is still above the current price, i.e., at $15.88, because of the bearish trend that followed in the last two days. The short-term trending line is once again traveling downwards, which is a major bearish signal.

As the volatility is mild, the upper Bollinger band value is at the $16.32 value, whereas the lower Bollinger band value has moved down to the $15.41 level. The RSI graph is also showing downward movement, as the score has gone close to the under-bought value as it is 52.44 for now.
Avalanche price analysis conclusion
Avalanche price analysis sums up that the prices are currently trading in a bearish trendline, and further losses in prices are imminent. The bears are seen to be adamant in pushing the prices below the $15.45 level which is expected to act as the closest support level. However, the bulls have come out to defend the $16.14 level as witnessed on the daily chart.
Disclaimer. The information provided is not trading advice. Cryptopolitan.com holds no liability for any investments made based on the information provided on this page. We strongly recommend independent research and/or consultation with a qualified professional before making any investment decisions.


