TL;DR Breakdown
- Binance Coin price analysis suggests sideways movement below $280
- The closest support level lies at $275
- BNB faces resistance at the $280 mark
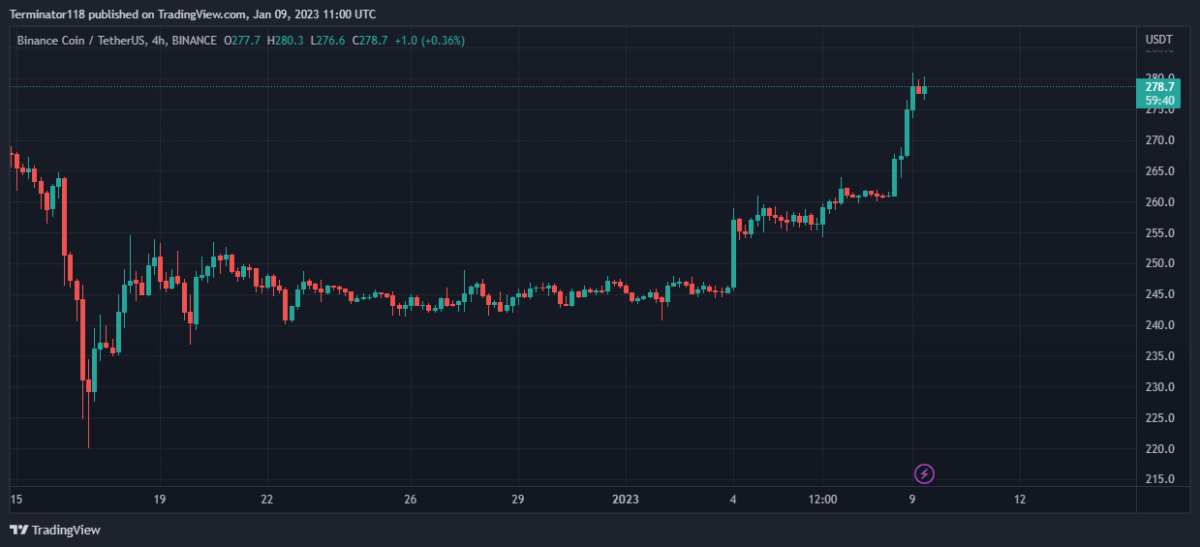
The Binance Coin price analysis shows that the BNB price action has climbed past the $275.00 mark as the bulls charge through.
The broader cryptocurrency market observed a bullish market sentiment over the last 24 hours as most major cryptocurrencies recorded positive price movements. Major players include SOL and DOT, recording a 21.32 percent and a 6.48 percent incline, respectively.
Binance Coin price analysis: BNB climbs past $275

The MACD is currently bullish, as expressed in the green colour of the histogram. Moreover, the indicator shows strong bullish momentum as expressed in the tall height of the histogram, Furthermore, the darker shade suggests an increasing bullish momentum as the price approaches the $80.00 mark
The EMAs are currently trading high above the mean position as net price movement over the last ten days remains positive. Moreover, the two EMAs trading at distance shows high bullish momentum. Furthermore, the diverging indicators suggest an increasing bullish momentum across the 4-hour charts.
The RSI is trading high in the overbought region as the indicator issues a sell signal suggesting a trend correction before the bulls can continue. Currently, the index is trading at the 85.23 mark showing strong bullish momentum with a horizontal slope suggesting a declining bullish pressure.
The Bollinger Bands are currently wide as the price shows sharp volatility rising from $245 to the current $278 in the past seven days. Currently, the price is trading near the indicator’s upper limit suggesting high volatility across the short-term charts. The indicator’s mean line provides support at the $264.40 mark while the upper limit presents a resistance level at the $278.50 mark.
Technical analyses for BNB/USDT
Overall, the 4-hour Binance Coin price analysis issues a buy signal, with 15 of the 26 major technical indicators supporting the bears. On the other hand, only two of the indicators support the bears showing little to no bullish presence in recent hours. At the same time, nine indicators sit on the fence and support neither side of the market.
The 24-hour Binance Coin price analysis shares this sentiment and also issues a buy signal with 15 indicators suggesting an upwards movement against only four suggesting a downward movement for the asset across the timeframe. The analysis shows bullish dominance across the daily frame with a low bearish presence still existing. Meanwhile, seven indicators remain neutral and do not issue any signals at press time.
What to expect from Binance Coin price analysis?

The Binance Coin price analysis shows that the Binance Coin market is enjoying a strong bullish rally as the price approaches the $280.00 mark. Currently, the price is facing strong resistance at the level and the bulls appear to be overstretched, however, if the bulls continue pushing, the next resistance level lies at the $300 mark.
Traders should expect BNB to slow down at the level as while the technical analyses are bullish, the momentum is overstretched and a bullish breakout above $280 may cause a crash back to the $260 level. Currently, the price can be expected to trade in the $270-$280 range for a while before making a bullish breakthrough.
[the_ad id=”48512″]
Disclaimer. The information provided is not trading advice. Cryptopolitan.com holds no liability for any investments made based on the information provided on this page. We strongly recommend independent research and/or consultation with a qualified professional before making any investment decision.


