The most recent Bitcoin Cash price analysis shows that there has been an upward trend for the previous 24 hours due to the price’s rapid growth. A continuation of the bullish trend is indicated by green candlesticks. Despite yesterday’s price adjustment, today’s trend is positive for buyers. As of April 9, 2023, the overall trend has been bullish, and the most recent uptrend has brought BCH/USD to its current value of $131.37.
BCH/USD 1-day price chart: BCH spikes as the bullish trend keeps going
The one-day Bitcoin Cash price analysis provides a favorable indication regarding the price movements of today. Due to the abrupt return of the bullish trend, the price has been trending upward during the last 24 hours. Despite the bulls prevailing consistently the week prior because the trend line was up, the coin denied more upside yesterday and entered a correction. Today, the price started to rebound again and reached $131.37, adding 2.29 percent to its value over the previous 24 hours. The price is currently above the moving average (MA) value of $127.25.
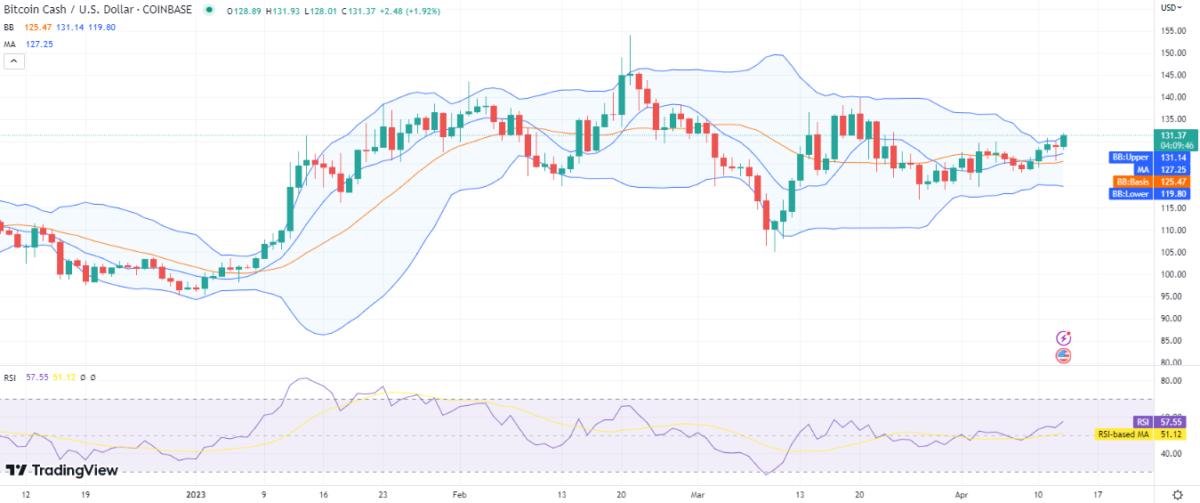
The price may have a further bullish boost in the coming days as a result of the price exceeding the upper limit of the volatility indicator, which is a sign that volatility is rising, which is favorable for predicting future market moves. Discussing the upper and lower values of the Bollinger bands indicator, the upper band shows a $131.14 value, which was the strongest resistance, whereas the lower band displays a $119.80 value, which is the strongest support for BCH. The Relative Strength Index (RSI) graph shows an ascending curve, and the index value has risen to 57. The indicator’s ascending graph provides a signal as to the market’s buying activity.
Bitcoin Cash price analysis: Recent developments and further technical indications
Due to the fact that buyers have been in charge of the price flow for the past 16 hours, the 4-hour Bitcoin Cash price analysis forecasts a strong positive trend for the market. The 4-hour price chart confirms an uptrend over the bigger picture by being marked by a string of green candlesticks. The higher price action is now confirmed by the short-term moving line. The coin’s value has climbed to $131.37 as a result of the positive trend. The SMA 20 curve is trending higher than the SMA 50 curve, which is another bullish sign. The moving average value is $129.34.
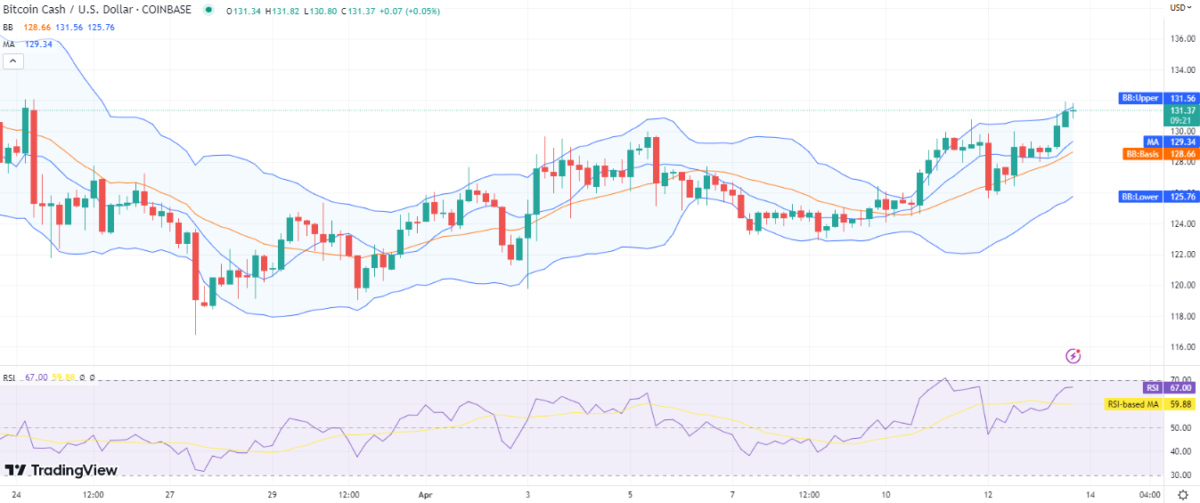
Currently, the Bollinger bands make an average of $128.66. Their lower edge reaches $125.76 at the same time that their upper edge is at a high of $131.56. The bullish trend has slowed, and as a result, the RSI score has leveled off at index 67. However, a further increase in the value of BCH/USD is anticipated in the coming hours.
Bitcoin Cash price analysis conclusion
The 1-day and 4-hour Bitcoin Cash price analysis shows strong bullish trend, as the price underwent a considerable improvement. The coin’s value is currently at $131.37 as a result of the growing bullish momentum. Within the next several hours, the market value of the coin should rise even further. On the other hand, selling pressure might also develop because the 4-hour chart suggests that resistance could exist at the $131.56 level, which could temporarily halt the rising price movement.