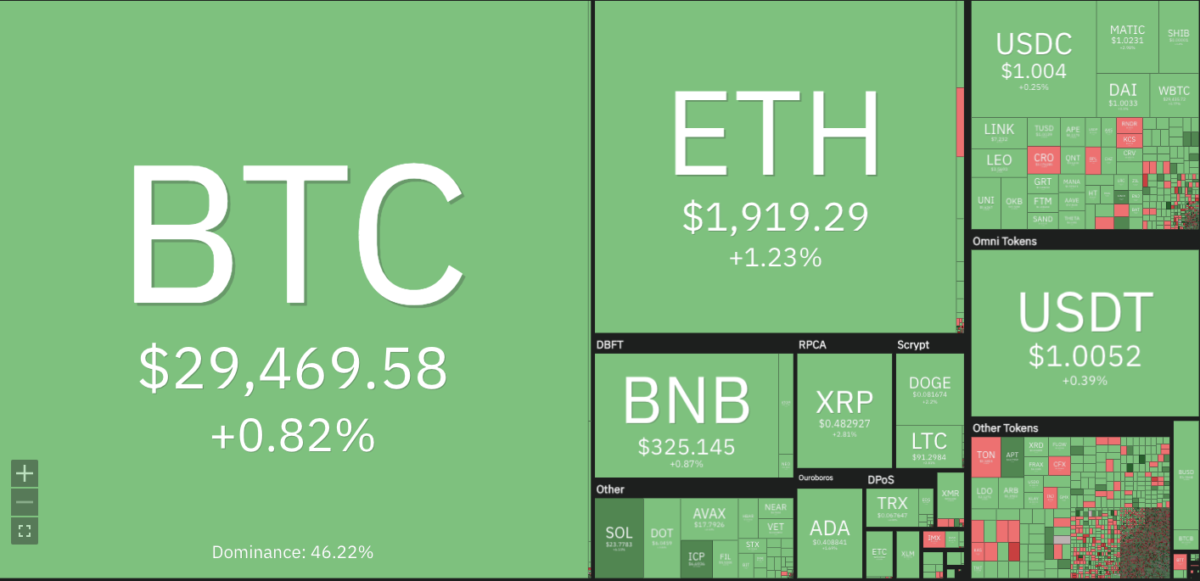
The latest Bitcoin price analysis shows a bullish trend today as the coin is recovering under high market pressure. BTC/USD can be expected to close at a lower high above the resistance level of $25,452. However bearish pressure is still there as the upwards price movement is slow as the bulls try to push BTC above this level.

The market is currently trading in a range-bound of $28,360 and $29,401 with a moderate bullish trend as buyers are trying to take control of the market at this crucial point. The volume has also increased over the past 24 hours as it has been rising steadily since the previous day. Currently, the trading volume is present at $32.34 billion, with a surge of 1.87 per cent in the past 24 hours.
Bitcoin price analysis 24-hour price chart: Bullish momentum is gaining traction
The 1-day price chart for Bitcoin price analysis shows that the coin, after falling below the $28,000 level earlier this week, however, the coin has been able to break out of the bearish trend it was in earlier this week and is currently in the consolidation phase with the bulls trying their best to push it higher. Currently, the BTC is up by 1.28 per cent in the last 24 hours, with a trading price of $29,401.

The RSI indicator is currently in the neutral zone at 55.98 and MACD shows the coin gaining momentum as the MACD line (blue) crosses above the signal line (orange). The Bollinger bands are expanding indicating high volatility in the market. The upper Bollinger band is at $31,367 and the lower is at $27,120 indicating that BTC is currently trading in a range.
Bitcoin price analysis: Recent developments and further technical indications
The 4-hour Bitcoin price analysis shows the bulls elevated the price steadily during the past few hours of the trading session following a strong correction yesterday. The green candle is also indicating that buyers are in control of the market and have been pushing the coin higher over the past few hours.

The moving average convergence divergence indicator is in the bullish zone and has crossed above the signal line. The histogram of the MACD indicates that the bulls are pushing BTC higher and the strength of their momentum is increasing. The relative strength index is currently at 57.13 showing no sign of bearish divergence as buyers are in control of the market. The Bollinger bands are widening indicating high volatility in the market.
Bitcoin price analysis conclusion
Overall, Bitcoin price analysis shows that the coin is recovering at $29,401 as bullish momentum gains traction. However, bearish pressure is present and a correction can be expected if BTC does not surpass the resistance level of $25,452. The technicals are also hinting that buyers are in control of the market and that BTC is likely to close at a higher high.
While waiting for Bitcoin to move further, see our articles on the Siacoin Wallet, Pi Wallet, and LTC Wallet Review.


