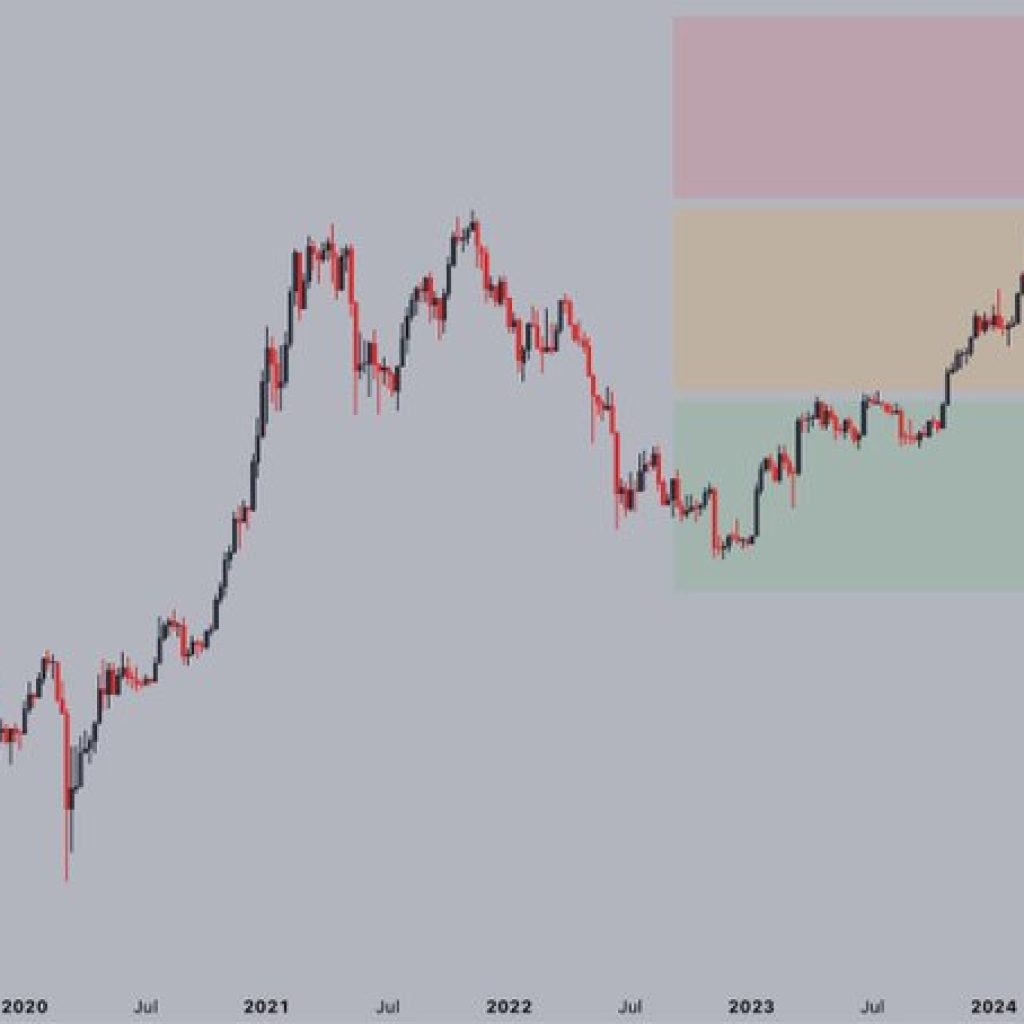
Bitcoin price analysis for today reveals Bitcoin is looking to close the month of February above the $23,500 level; this is a key level for the cryptocurrency for several reasons. Bitcoin price analysis shows a faint glimmer of hope for bulls, as BTC finally closed above the 50-month moving average (MA). This is a key trend line that had been acting as a strong resistance since mid-January, and its breach signals a potential bullish continuation.

Bitcoin’s market is developed some buying activity in recent hours as the price has reclaimed the $23,500 level. BTC’s price is currently hovering above $23,500 and is trading in a range of $23,205.88 and $23,585.38, with a 24-hour trading volume of $20.4 billion.
Bitcoin price analysis in the last 24 hours: Recent developments
Bitcoin price analysis in the last 24 hours shows BTC/USD has been circling an area around the $23,500 level. Bitcoin is trading at $23,472.99, up by 0.40% in the last 24 hours, according to data from CoinMarketCap.Bitcoin has been bullish, with a key support of $23,300 and a resistance of $24,000.

The Simple Moving Average SMA) is also showing a positive outlook for Bitcoin, with the 200 SMA crossing above the 50 SMA, which is considered a buy signal. The Relative Strength Index (RSI) has also been trending upward, indicating that buyers are accumulating BTC.
The bulls are targeting to break above the Fibonacci extension level of 1.618, located at $24,500. A breakout above this level would signal further upside potential, with the next target being $25,000.
On the other hand, if the bears push BTC/USD below the support at $23,300, the Fibonacci retracement levels of 23.6%, 38.2%, and 50% will be the next possible targets, located at $22,200, $21,600, and $20800 respectively.
The Bollinger bands have widened at the moment, with the upper band touching the EMA50 and the lower band touching EMA20. This indicates heightened volatility in the market. The key support has been established at the lower band, with the price currently trading above it.
BTC/USD 4-hour chart analysis: BTC/USD is currently trading just above the 50-MA
The 4-hour chart shows BTC/USD is trapped in a triangle formation, with both the bulls and the bears struggling to gain control of the market. The buyers are pushing for a break above the key resistance at $24,000 while the sellers are trying to break below $23,300.
BTC/USD is currently trading just above the 50-MA and if it manages to stay above, this could potentially signal an uptrend in the near future. The MACD indicator shows that momentum is on the side of buyers, with positive divergence being seen.

The Relative Strength Index is flat, with a reading of 49.29. This suggests that the market is currently undecided and further movements are needed before a definite trend can be determined.
Bitcoin price analysis conclusion
Overall, Bitcoin price analysis for today shows that BTC/USD is trading above the key 50-MA level, suggesting a potential upside in the near future. However, the bulls need to break above $24k before any significant move higher can be seen. If the bears manage to push the price back below $23.3k, this could signal a possible trend reversal in the near future.