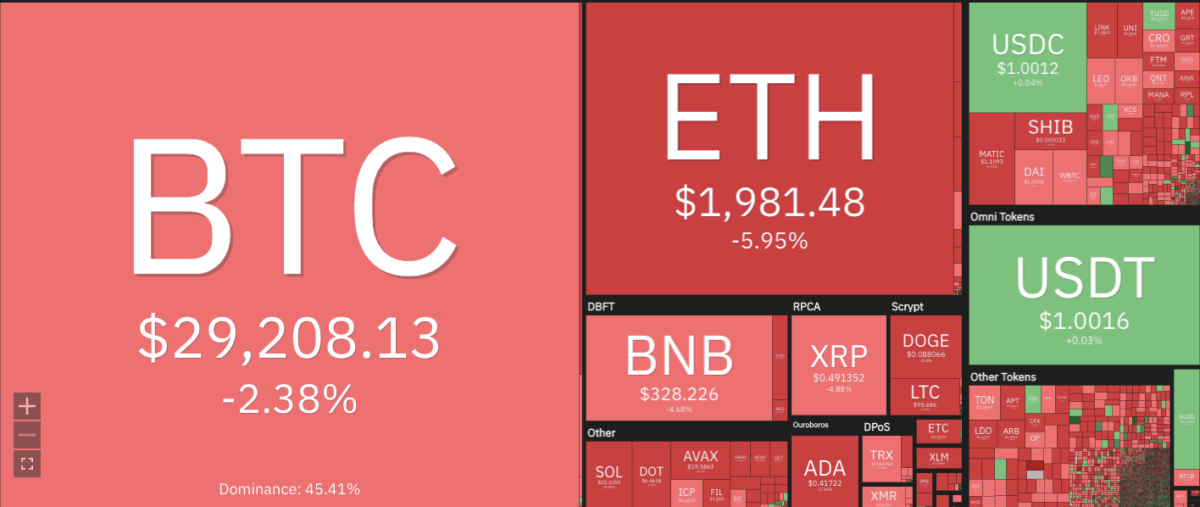
The Bitcoin price analysis for today is in favor of the bears as the prices continue to bleed downwards. BTC dropped below the $30,000 barrier after facing strong selling pressure from sellers. The past few days have been particularly harsh for Bitcoin as the bears started to gain control of the market. At the time of writing, BTC is trading at $29,208, a loss of more than 2.38 percent in the last 24 hours.

Key support for Bitcoin prices is seen at $29,102 and any break below this level could increase selling pressure and lead to further losses. If buyers can manage to defend this level, then it could lead to a bounce back in prices towards the $30,000 psychological mark.
Most of the cryptocurrencies are trading in the red today and it is likely that the prices may continue to fall further in the coming days. The other top coins, Ethereum and Ripple, are also trading in red and are at risk of further losses.
Bitcoin price action in the last 24 hours: BTC touches $29,208 lows as bears rule the charts
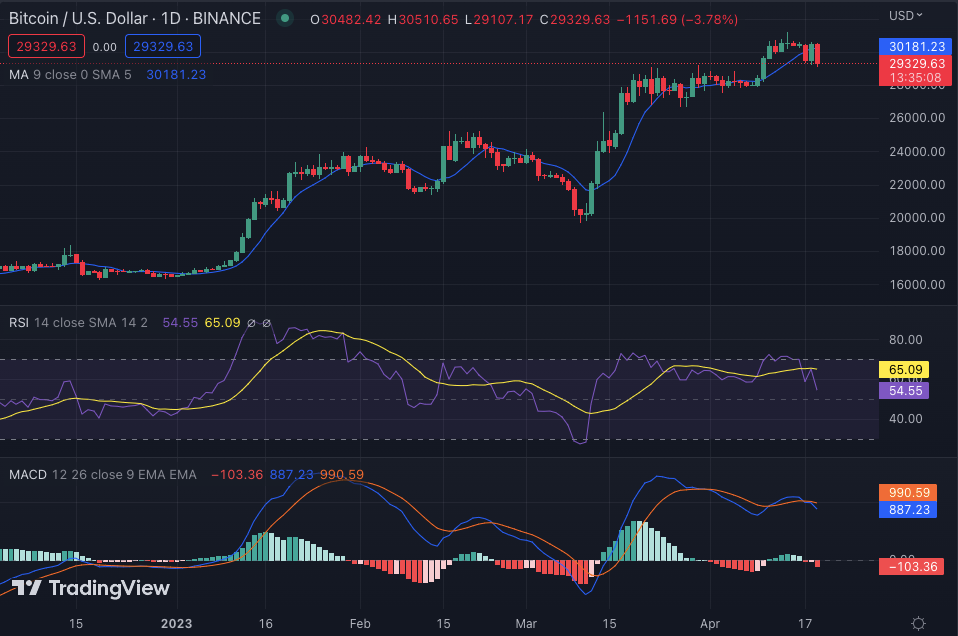
Bitcoin price analysis has been on a downward spiral in the last 24 hours and is currently trading between a range of $29,102 to $30,470, indicating a tight-range bound action. The downtrend is expected to continue soon as the bears maintain control over the market sentiment as per Bitcoin price analysis. The prices are likely to dip further down as the selling pressure intensifies in the coming days.
The market capitalization of the coin has also seen a sharp dip and is currently at $565 billion, with a decrease of 2.34 percent in the last 24 hours. BTC dominance has also risen to 45.41 percent as most other altcoins continue to struggle against the dollar. However, the trading volume is up by 36.33 percent in the last 24 hours, at $23.68 billion, indicating a strong demand for the coin.

The technical indicators are in favor of the bears and suggest that the prices could dip lower in the near future. The RSI is currently at 54.55, and is showing no signs of a reversal. The MACD indicator is also in bearish territory and indicates that the selling momentum is still strong. The Chaikin Money Flow indicator is also negative and suggests that the selling pressure is increasing. The moving averages are also in a downward trend and suggest that the prices could head lower.
Bitcoin price analysis on a 4-hour price chart: Recent developments and technical indications
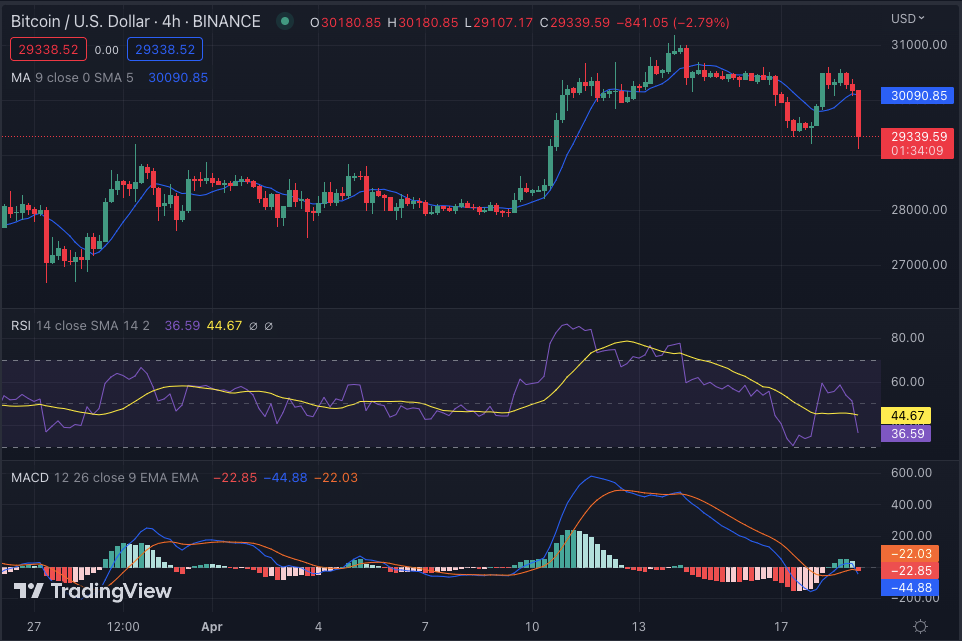
The 4-hour price chart for Bitcoin price analysis shows the price is going down once again after the bears managed to secure grounds on the Candlestick chart. The market has been favorable for the buyers for most of the past week, but strong selling pressure in the last 24 hours has managed to put a stop to it.

The 50-day Moving Average is currently at $29,338, and is below the 200-day Moving Average, which currently stands at $29,339. This suggests that the market could face further losses in the coming days. The MACD indicator has also turned bearish and indicates that sellers are in control of the market. The histograms are in red and the signal line is below the MACD, confirming a strong bearish sentiment. The RSI indicator is currently at 36.59 in the oversold region, and suggests that the prices could head lower in the near future as there are no signs of a bullish reversal yet.
Bitcoin price analysis conclusion
The Bitcoin price analysis for today shows that the prices are still under pressure from sellers despite a few attempts at recuperation. The overall trend remains bearish and further losses cannot be ruled out in the near future. Bulls are expected to defend the key support level at $29,102 in order to avoid a further decline. The technical indicators are all in favor of the bears and suggest that the selling pressure could increase further in the coming days.
While waiting for Bitcoin to move further, see our Price Predictions on XDC, Polkadot, and Curve


