The latest Bitcoin price analysis reveals that the BTC market has been trending downward over the past few days. The bears have taken control of the market, and this is likely to extend further as the USD continues to strengthen. The BTC/USD pair is currently trading at $27,522, which is lower than yesterday’s close of $28,208.
The market sentiment remains bearish as investors continue to look for an exit from the asset. Bitcoin is facing strong resistance at the $28,208 level, and it has been unable to break above this mark. The support level for BTC is currently at the $27,039 mark which could be tested if the current momentum continues.
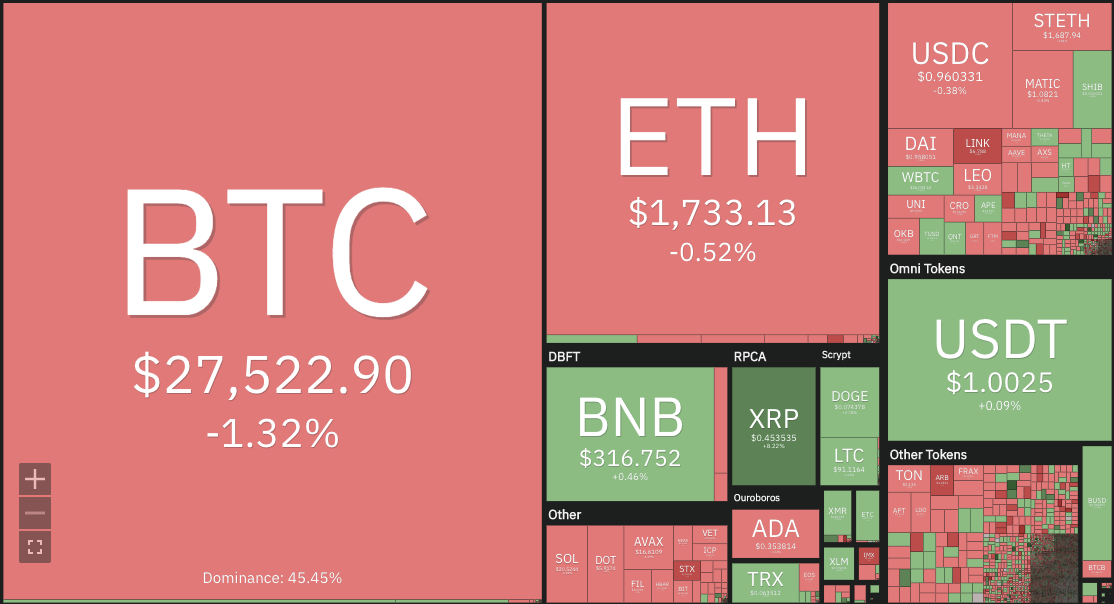
The trading volume for BTC is seen to be relatively low at the moment, indicating a lack of buyers in the market. Currently, it stands the trading volume is currently standing at $16 billion, which is lower than yesterday’s figure. The market capitalization for BTC is also seen to be declining and is currently standing at $532 billion, down by 1.34 percent compared to yesterday’s figure.
BTC/USD 1-day price chart: Coin value demotes to $27,522 after bearish rush
The 24-hour Bitcoin price analysis indicates that the token has experienced a volatile session. The bears initially pushed the token below the $28,000 mark before it quickly recovered and hit an intraday high of $28,178. However, it failed to sustain its gains and started retracing lower as investors continued to exit their positions in the asset.
The daily chart for BTC indicates a bearish crossover with the MACD, indicating more losses in the near term. The Relative Strength Index (RSI) is still trending lower and is currently positioned at 63.04; any further downside pressure could take it even lower.
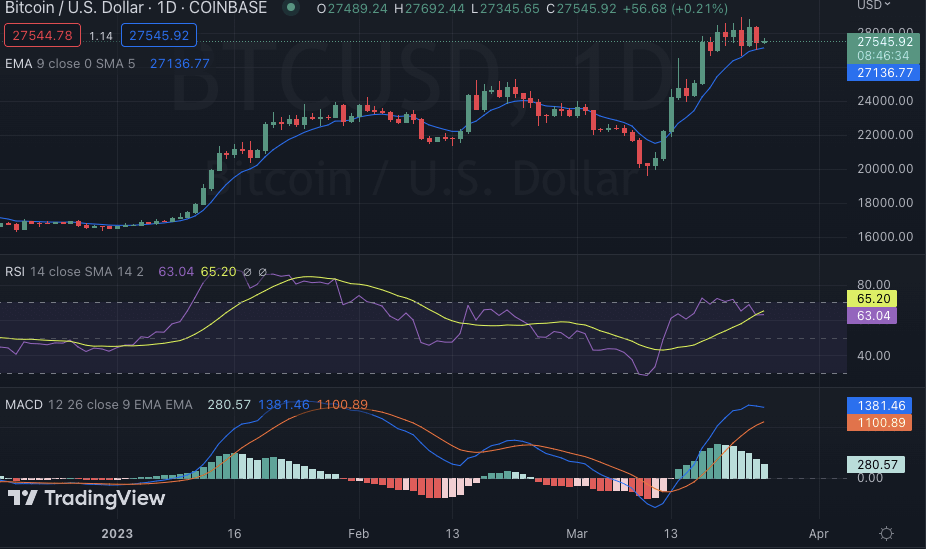
The 50-day Exponential Moving Average (EMA) is currently noted at $27,544, while the 200-day EMA is seen around $27,545, indicating that bulls need to take control of the market soon and bring in some buying pressure or else prices could continue lower from here.
Bitcoin price analysis: Bearish wave continues as price downgrades further to $27,522
The four-hour chart for Bitcoin price analysis indicates that the bears have regained control of the market and are pushing prices lower. The market for BTC opened today’s market at $27,619, and selling pressure has been increasing as the day progresses pushing the token below the $27,500 mark.
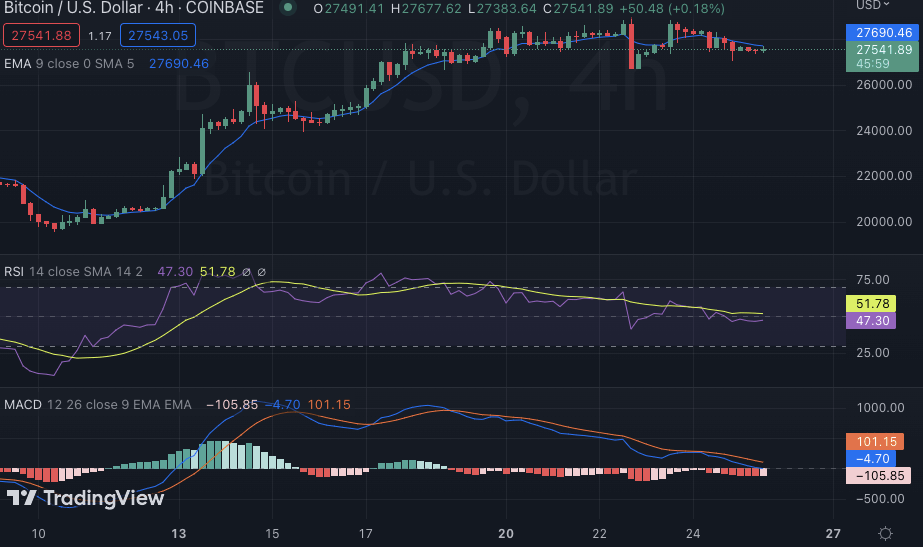
The Moving Average Convergence Divergence (MACD) is still trending downwards, and any further losses could push it further lower into bearish territory. The histogram has also been decreasing with red bars indicating that the selling pressure is increasing. The Relative Strength Index (RSI) has also been decreasing and is currently seen at 47.30, which indicates that BTC could experience further losses in the near term. The EMA crossover is also seen with the 50-day EMA crossing over the 200-day EMA, indicating a bearish trend in the market.
Bitcoin price analysis conclusion
Overall, Bitcoin price analysis remains bearish today as investors continue to look for exits from the asset. The token has dropped below $28,000, and any further losses could take it even lower. The support level for the token is currently seen at $27,039 and if this level is broken, prices could drop even further. However buying pressure could increase if the market sentiment starts to improve, taking BTC back above $28,000.
While waiting for Bitcoin to move further, see our Price Predictions on XDC, Cardano, and Curve