The most recent Bitcoin price analysis has seen a strong buying surge which indicates the bullish strength of the coin. The past few weeks have seen Bitcoin consolidate at around $28,000 before finally breaking through. This action is consistent with BTC’s previous trend of rising prices as it continues its long-term bull run. Bitcoin has hit $30,000 for the first time since last June and has set a new price high for 2023 as more and more institutional investors become involved in the crypto space.
Traders are anticipating insights into the Federal Reserve’s fight against inflation from the United States Consumer Price Index (CPI) report on April 12. Some analysts predict that this could push the price of Bitcoin back up to $30,000. The BTC/USD has surged by more than 46 percent in the last 30 days, with some traders expecting it to continue to reach new all-time highs.
Bitcoin price analysis 24-hour chart: BTC surges by 6 percent after a solid bullish breakout
The 24-hour chart on Bitcoin price analysis shows a strong bullish momentum as the bulls pushed past $30,000. The market for BTC opened today’s session at $29,134 and rose to $30,038 after bulls broke through the resistance level of $30,160. BTC/USD has since consolidated its gains and currently trading above the $30K mark.
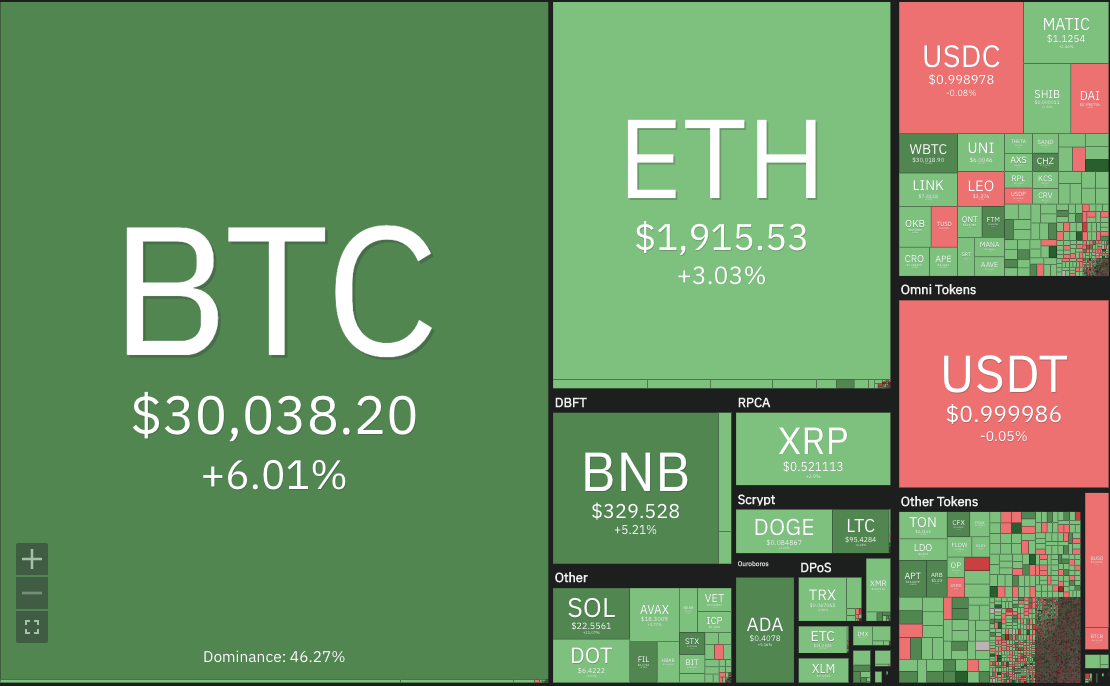
The BTC tokens as also surged more than 6 percent in the last 24 hours, with a strong buying volume of more than $24 billion. Trading volume has increased by more than 93 percent in the last 24 hours, indicating a strong bullish sentiment. The market capitalization of Bitcoin is also up to $581 billion, representing a market dominance of more than 60 percent. The current circulating supply of the token is 19 million tokens.
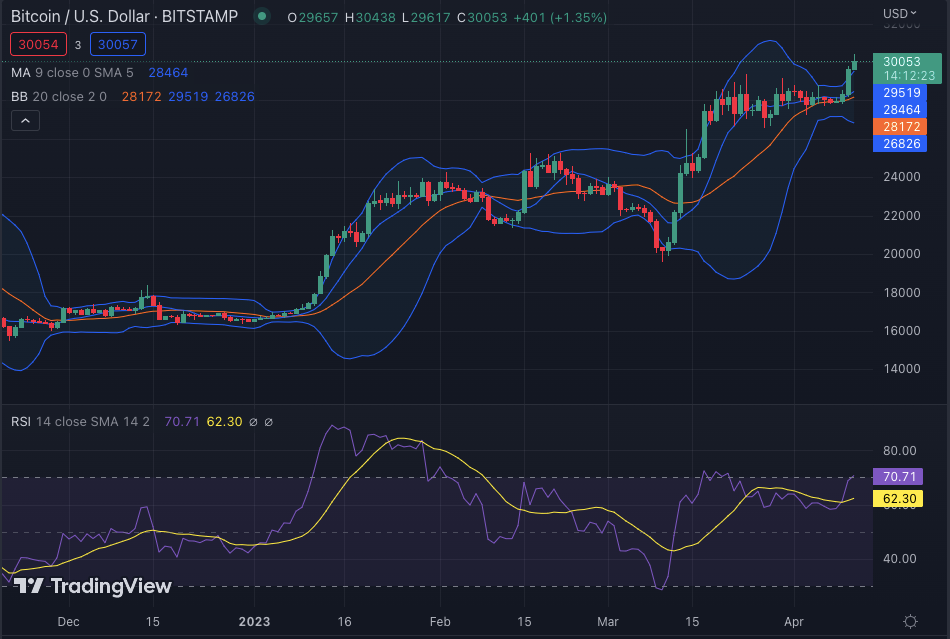
The Relative Strength Index (RSI) on the chart above indicates that BTC/USD is in an overbought region, and traders should be cautious of a possible pullback if the market turns bearish. The 50-EMA and 200-EMA are also indicating a bullish trend, as the former is above the latter. The moving average indicator is seen at $28,464 in the daily chart. The volatility is high, with the Bollinger bands widening, indicating a possible breakout.
Bitcoin price analysis: Recent developments and further technical indications
The 4-hour chart for Bitcoin price analysis shows the bulls are having trouble breaking through the resistance level of $30,160, which was the current level the market broke through earlier in the day. And if bullish momentum continues, BTC/USD could push through the resistance and reach new all-time highs. The support level of $28,189 is also holding up well and could support the price if there is a pullback.
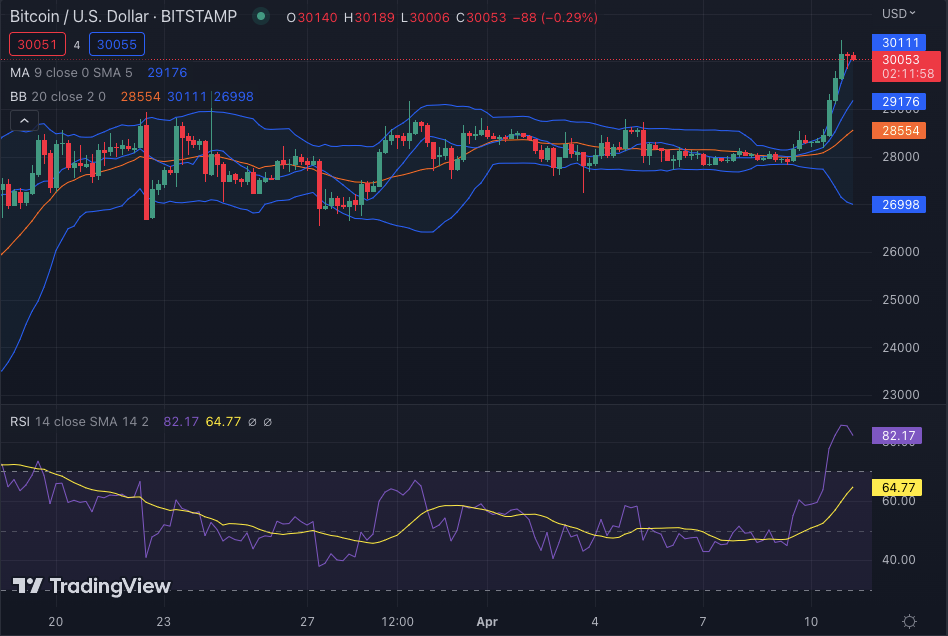
The hourly Bollinger bands are expanding, indicating a period of high volatility. The upper Bollinger band is seen at $30111, and the lower Bollinger band is seen at $26,998, indicating that the tokens are trading in a tight range. The Relative Strength Index (RSI) is seen at the overbought region with an RSI score of 82.17, and buyers are in control as Bitcoin undergoes more bullish action. The hourly moving average indicator is seen at $29,176, and a break above this level could see the tokens reach further highs.
Bitcoin price analysis conclusion
In conclusion, Bitcoin price analysis shows that BTC/USD is continuing its bull run and has broken through the key level of $30K, which is the highest level since June 2022. The market appears to be consolidating its gains but could push higher if bullish momentum continues. Technical indicators are showing that BTC/USD is in a strong uptrend and could reach new highs if the bulls can break through the resistance level at $30,160.
While waiting for Bitcoin to move further, see our Price Predictions on XDC, Polkadot, and Curve