The Bitcoin price analysis shows a recovery from the recent losses. The BTC/USD has been trading above the $24,500 level for more than a day now, which is a sign of bullish momentum. The BTC/USD is showing an upward trend, as the pair has climbed $24,722, with an increase of more than 1.89 percent over the last 24 hours.
The market is still dominated by buyers as Bitcoin price continues to surge higher. The rising momentum has pushed BTC above the $24,500 level, and a strong support level has been established at $23,964. If buyers can manage to maintain this price level above $23,964, then the path for further bullish movement will remain open. The resistance level is set at $25,083, which is the next target for bulls if the trend continues.
The surge is due to the increasing optimism among investors and traders, who are feeling more confident about their investments as Bitcoin price is continuing to hit new all-time highs. In addition, the Crypto banks such as Silvergate Bank and Signature Bank are providing crypto-friendly banking services, which have led to increased liquidity in the market.
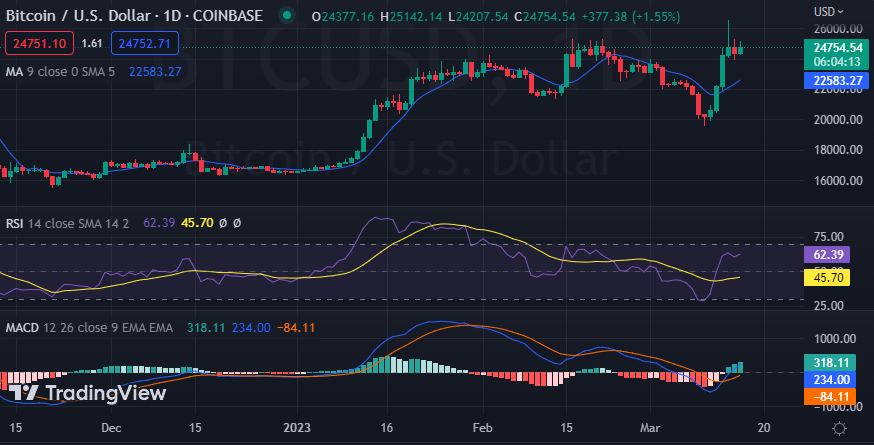
BTC/USD 1-day price chart: Bulls recover $24,722 level eye $25,000 next
The 1-day price chart for Bitcoin price analysis shows the cryptocurrency analysis is going in a bullish direction today, as buyers have marked their dominancy once again. The bullish momentum is not huge but has successfully been able to dodge past the bearish building momentum.
The BTC/USD has a 24-hour trading volume of $34 billion, which is slightly lower than the previous day’s volume. On the other hand, the market cap has been increased to $477,211,706,1,40, with a market circulation of 19,319,193 BTC tokens. The Moving Average Convergence Divergence (MACD) is also showing a positive divergence, as the MACD line has crossed above the signal line. This could pave the way for continued upward pressure in the BTC/USD in the near future.

The relative strength index (RSI) is also in the bullish territory, with a value of 62. This is an indication that buyers still have enough energy to push Bitcoin prices higher. The moving average value is currently at $22,583, which could act as a strong support level if the BTC price falls.
Bitcoin price analysis: Recent developments and further technical indications
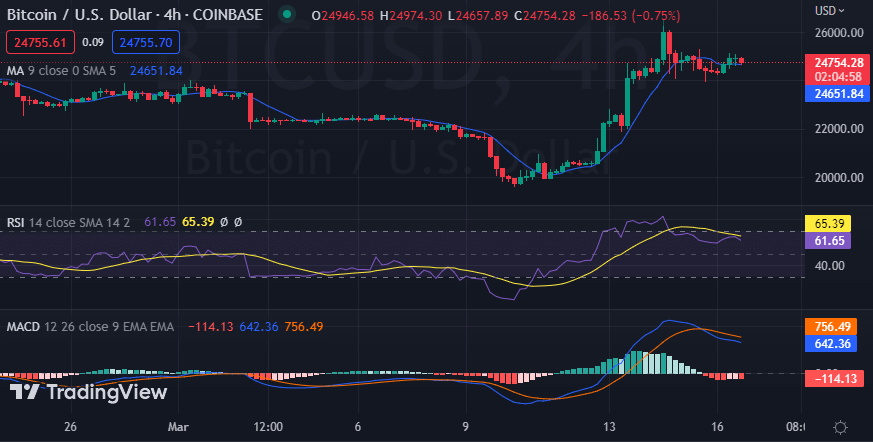
The 4-hour Bitcoin price analysis is also depicting a slight rise in the price levels today. The bullish momentum has been continuous, and the price has been gradually moving upwards for the past hours to reach the value of $24,722.

Across the technical indicators, the MACD is currently bullish, as expressed in the green color of the histogram. The RSI is on the higher side of the chart at 61, which is a sign of buyer dominance. The 50-day EMA is about to cross above the 200-day EMA. This indicates an upcoming bullish crossover and could trigger more buying pressure in Bitcoin. The 50-day moving average and the 100-day moving average are moving in the same direction, which is a sign of an upsurge.
Bitcoin price analysis conclusion
Overall, Bitcoin price analysis shows a bullish trend in the BTC/USD pair. The bulls are showing no signs of slowing down, and they have the urge to continue driving the prices higher. Therefore, if the buyers can maintain their momentum over the $24,722 level, then they are up for a bullish breakout. The next resistance level is set at $25,083, and if the bulls can make it past this level, then the price might even hit new all-time highs. On the downside, the major support level is set at $23,964. Any drop below this could cause some selling pressure.
While waiting for Bitcoin to move further, see our Price Predictions on XDC, Polkadot, and Curve


