
The latest Bitcoin price analysis for today shows that BTC/USD is regaining bullish momentum. The current market price of the world’s largest cryptocurrency, Bitcoin stands at $27,023 with an increase of 1.03 percent in the last 24 hours. The Bull’s pressure has pushed Bitcoin up from yesterday’s low of $26,606.

The support level is holding strong at the $26,606 mark as buying pressure remains consistent and if the bearish pressure is held down, the asset could continue to increase in value. Bitcoin also has a critical resistance level of $27,304 that must be broken for bulls to gain more control and push the price up further.
The market cap has also surged by nearly 0.52 percent in the last 24 hours as it stands at $523 Billion. The 24-hour trading volume also remains high as it stands at $17 Billion showing strong support for the digital asset in the market. The circulating supply of BTC stands at 19 Million coins in the market.
Bitcoin price analysis 24-hour chart: BTC levels up to $27,023, bulls manage to penetrate
The daily chart for Bitcoin price analysis also highlights the upward trajectory of the price and further increases in momentum may be seen over the day. However, the previous week the BTC was hovering above the $27,500 level, the bearish pressure shifted the asset to its current level past hours then bulls managed to take over and penetrate the support level.

The volatility in the market is also increasing and this sentiment could be seen in the Bollinger bands widening The upper Bollinger band is at $31,109, which could be a significant target for traders in the near future, while the lower Bollinger band is at $20,211 which could act as a support level if the price retraces.
The Moving average indicator is also showing a bullish sentiment as it moves upwards. The Relative Strength Index (RSI) stands at 57.98 which shows that there are no overbought or oversold conditions in the market, indicating the further potential for growth in the near term.
Bitcoin price analysis on a 4-hour price chart: BTC set to break out higher
The 4-hour Bitcoin price analysis chart shows that the cryptocurrency is still holding strong with bullish momentum. The market has a higher chance of breaking out above the critical resistance level at $27,304. Looking at the daily chart for the altcoin, the price is moving above the 20-day simple moving average (SMA) and the 50-day SMA. This indicates that buyers are in control of the market and the uptrend is likely to continue.
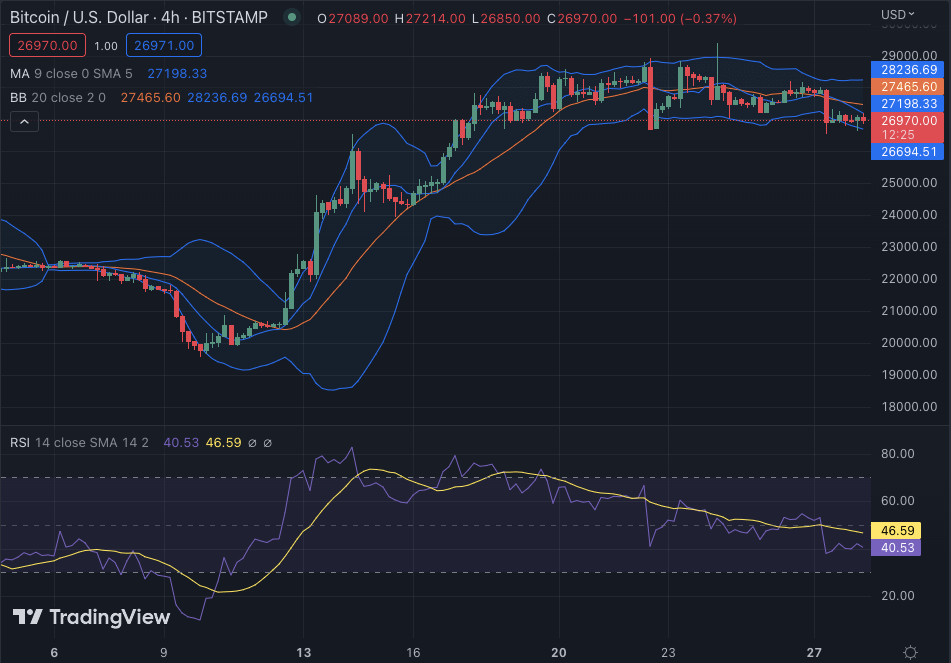
The 50-day moving average and 200-day moving average are also moving upwards, indicating that the bulls are confident and the trend is likely to remain bullish in the near term. The Relative Strength Index (RSI) stands at 40.53 and shows that the asset is neither overbought nor oversold. The Bollinger Bands have also widened, indicating increased volatility in the market. The upper Bollinger band is at $28,236 and the lower Bollinger band is at $26,694.
Bitcoin price analysis conclusion
Overall, Bitcoin price analysis shows that BTC/USD has a good chance of continuing its bull run in the near term as long as it manages to break out above the critical resistance level of $27,304 and hold its current level of support at $26,606. The technical indicators are also signaling a strong uptrend and the asset is likely to remain bullish in the near term. However, with continued bullish momentum, BTC/USD has a good chance of surpassing previous highs in the coming days.
While waiting for Bitcoin to move further, see our Price Predictions on XDC, Cardano, and Curve


