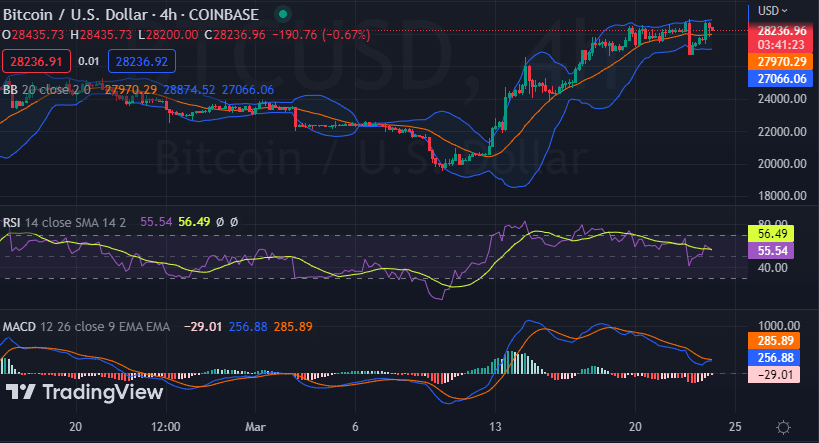
The Bitcoin price analysis is showing a positive sign, as the bulls have been successful in pushing the price higher. The BTC/USD is currently trading above the $28,000 level, representing a solid bullish trend. The upside momentum looks strong, and the price is likely to continue higher if the bulls can sustain their pressure. The BTC/USD is currently at $28,180 after a price surge of 4 percent in the last 24 hours.
The green candlestick is seen in most of the cryptocurrencies, indicating that the bulls are in control. The Bitcoin price analysis is bullish, and the next stop could be at the $28,500 level if a strong break of resistance happens. The buying pressure is increasing, and this could bring the price even higher in the near future.
Bitcoin price analysis for one day: BTC rises to $28,180 as the bullish trend aggravates
The 24-hour Bitcoin price analysis is bullish as the bulls have pushed the price of BTC above the $28,000 mark. The support is at $26,760, which was tested earlier and successfully held. The current 24-hour trading range is between 26,760 – 28,729. The buying pressure is increasing in the market, as indicated by the green candlestick. The 24-hour trading volume is $25 billion, which suggests that the bulls are in control of the market. The market cap is currently at $544 billion, indicating that the market sentiment is quite bullish.

The volatility in the market is also increasing, and this sentiment could be seen in the Bollinger bands widening. The upper Bollinger band is at $29,945, which could be a significant target for traders shortly, while the lower Bollinger band is at $18,759, which could act as a support level if the price retraces. The moving average convergences/divergence (MACD) is also in the bullish zone, which confirms the upward price action of Bitcoin. The RSI is also in the overbought zone, indicating that Bitcoin price could see some profit-taking in the near future.
Bitcoin price analysis 4-hour Chart: Ascending parallel channel is seen
The 4-hour chart for Bitcoin price analysis shows that the digital asset has formed an ascending parallel channel and is currently trading near the upper boundary of the channel. The prices have recently broken above the $28,000 level and are now facing resistance at $28,279. The market has made highs and higher lows, which is a bullish sign.
Looking at the hourly chart for the coin, the price is moving above the 20-day simple moving average (SMA) and the 50-day SMA. This indicates that buyers are in control of the market, and the uptrend is likely to continue.

The Bollinger bands on the 4-hour chart have widened, and this could indicate increased volatility in the market. The upper Bollinger band is at $28,874, and the lower Bolinger band is at $27,066. The MACD line has moved above the signal line, which suggests further upside momentum in the near future. The RSI is also currently in the overbought zone, indicating that a pullback could be imminent.
Bitcoin price analysis conclusion
In conclusion, Bitcoin price analysis shows that the bulls are in control of the market, and they have been successful in pushing the price above $28000. The buying pressure is increasing, and this could lead to further upside momentum in the near term. The buyers need to defend the $28,000 level if they want to maintain control of the market.
While waiting for Bitcoin to move further, see our Price Predictions on XDC, Polkadot, and Curve


