Cardano price analysis is bullish as it shows the cryptocurrency price is on an uptrend and has gained momentum over the past few weeks. The price jumped 1.00 percent in the last 24 hours, hitting $0.389 at its peak. The bears were in control of the market earlier today, but the bulls have taken over and have pushed prices higher. The ADA/USD pair has broken through the support level at $0.3816 and is trading above the $0.389 level with strong upside momentum.
The next major resistance for Cardano will be near the $0.3915 region, where the bears may try to take back control of the market and push prices lower. If they succeed, we could see a pullback to the $0.3796 level, which is a major support. On the other hand, if the bulls can break through this resistance level and hold above it, we could see an upside move toward $0.3902 in the near future.
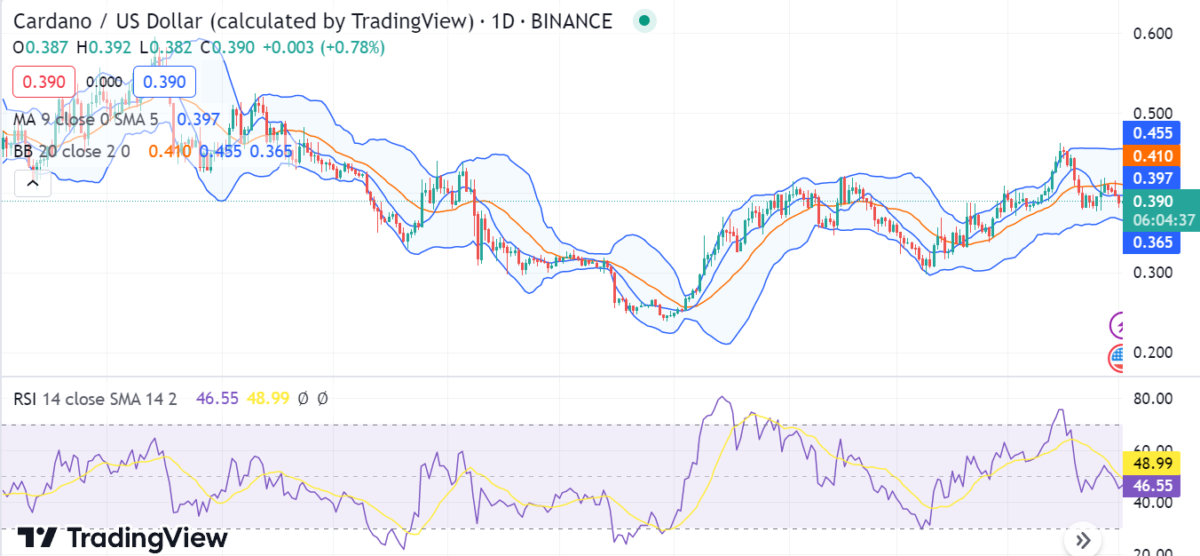
Cardano price analysis 1-day chart: ADA/USD faces rejection at $0.3906
Looking at the Cardano price analysis for the 1-day chart, reveals strong bullish momentum, with more price increases anticipated over the next few hours as bulls continue their surge. The ADA/USD pair has had a 24-hour price gain of 1.00%, with a total trading volume of $205 million and a market cap of $13.5 billion. The ADA/USD pair has a current market value of $0.389 and strong bullish momentum that looks set to push prices higher in the near future.

The 1-day Cardano chart shows that the cryptocurrency is currently trading well above the 50-day moving average, which indicates a long-term bullish trend. The Relative Strength Index (RSI) is at 46.55, indicating that the market is neither overbought nor oversold. The volatility has been comparatively mild, which means further uptrends may follow. Moving on, the Bollinger bands’ values are as follows: the upper band is at $0.455 and the lower band is at $0.365, which further indicates a bullish trend in the near future.
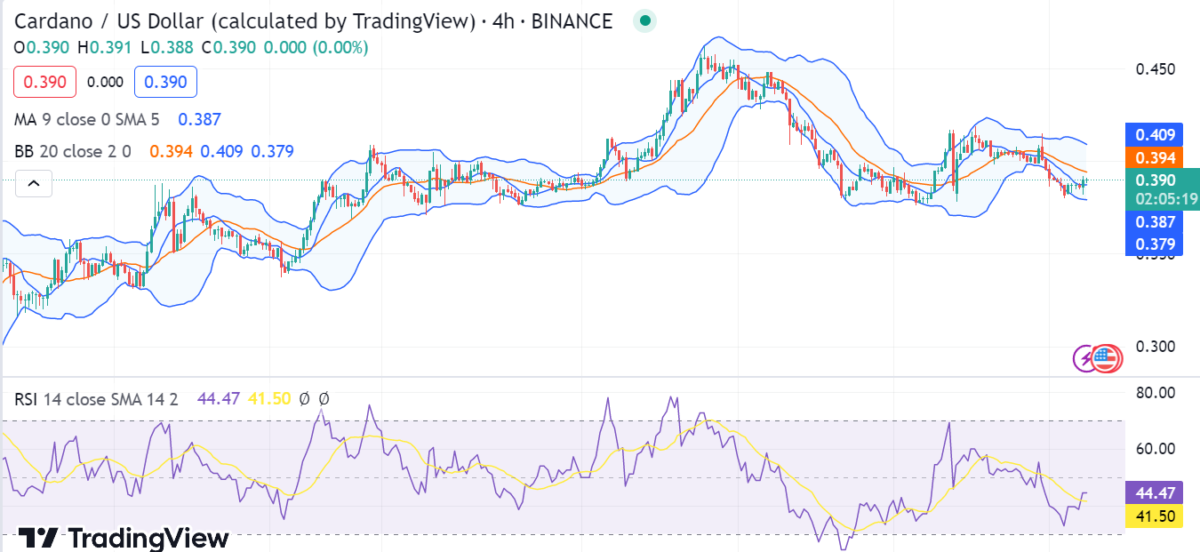
ADA/USD 4-hour price chart: Latest development
The 4-hour Cardano price analysis shows that the market is still in a range-bound state, with buyers pushing prices up and sellers resisting at the $0.3816 level. The ADA/USD has had a pullback for the last few hours. The bulls were successful in recovering from the loss and pushing the market back to its original position. The cryptocurrency recovered again, as the price has been lifted up to $0.389 now. It looks set to break through this resistance and make another attempt at higher levels.

Looking at the 4-hour chart, the ADA/USD pair is currently trading above the 50-day moving average at $0.387, indicating bullish momentum in the short term. The Bollinger Bands have expanded a bit, as the upper band is now at $0.409, and the lower band is at $0.379. The RSI indicator is currently at 44.47, which means that the market is neither overbought nor oversold and is likely to remain unchanged in the near future.
Cardano price analysis conclusion
In conclusion, the Cardano price analysis shows that the coin is in a strong bullish momentum as the price is reading above $0.389.There is no sign of a reversal in sight, and the ADA/USD pair may continue to rise in the coming days. The positive sentiment among crypto traders and investors is likely to continue to drive the price higher, and with no major resistance levels in sight, the token could potentially reach new highs.


