
Cardano price analysis shows a bullish signal today as the price rises to the $0.3828 mark and is up by 0.44 percent in the last 24 hours. The digital currency has been on a steady uptrend since the start of the week, reaching its highest level. The ADA coin has been gaining momentum recently as it has surged past the $0.382 mark and is now trading above it. The technical chart shows that the digital currency has managed to break out of its immediate resistance at $0.4033 and is now headed toward the $0.4035 level. The support for ADA/USD pair is currently at $0.3729 and if the bulls manage to push the price above $0.4035, then an extended rally is likely. The 24-hour trading volume is now at $494 million and the market capitalization is currently at $13.317 billion.
ADA/USD 1-day price chart: Bullish vigor increases to $0.3828
The 1-day Cardano price analysis confirms that the digital currency is trading in the bullish zone, as indicated by its upward trend. This suggests that the bulls are in charge of the market, and the price may continue to move higher in the near term. The Relative Strength Index (RSI) is currently at 57.44, indicating that the digital currency has room to continue its uptrend.

The MACD indicator is also in the bullish zone, indicating that the digital currency could possibly extend its rally. The Moving Average Convergence Divergence (MACD) line is about to cross the signal line in the positive zone, which could indicate a further price increase. The Bollinger band’s upper value is $0.403, representing the resistance for ADA, whereas the lower value is $0.319 representing the strongest support for ADA price.
Cardano price analysis 4-hour chart: ADA/USD trades at $0.3828 after a bullish run
looking at the hourly Cardano price chart shows that the digital currency is maintaining its bullish momentum and may soon break out of its immediate resistance at $0.4035. The green candlesticks are marking a rise in price over the past four hours. The price has reached near the upper limit of the volatility indicator as the buyers currently control the market trends.
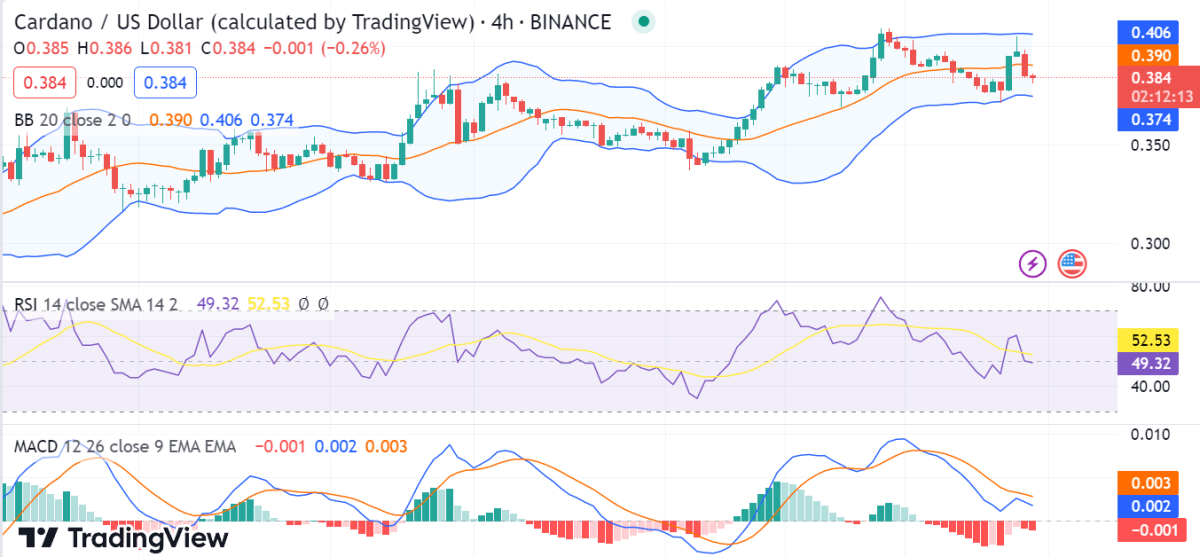
The upper band of the Bollinger bands indicator is present at the $0.406 mark, and the price is traveling towards the upper band, whereas the lower band is present at the $0.374 mark. The MACD shows that the short-term moving average has crossed over with the long-term moving average, indicating a bullish trend. The relative strength index (RSI)is currently at 49.32 which shows that the digital currency is overbought.
Cardano price analysis conclusion
Overall, it looks like the Cardano coin could continue its uptrend and break out of its immediate resistance level. The ADA indicator shows that the bulls are in control of the market as buying pressure is rising. Cardano’s value is currently at $0.3828. If the bulls can keep up the pressure, then ADA could soon break out of its immediate resistance level and continue its uptrend.


