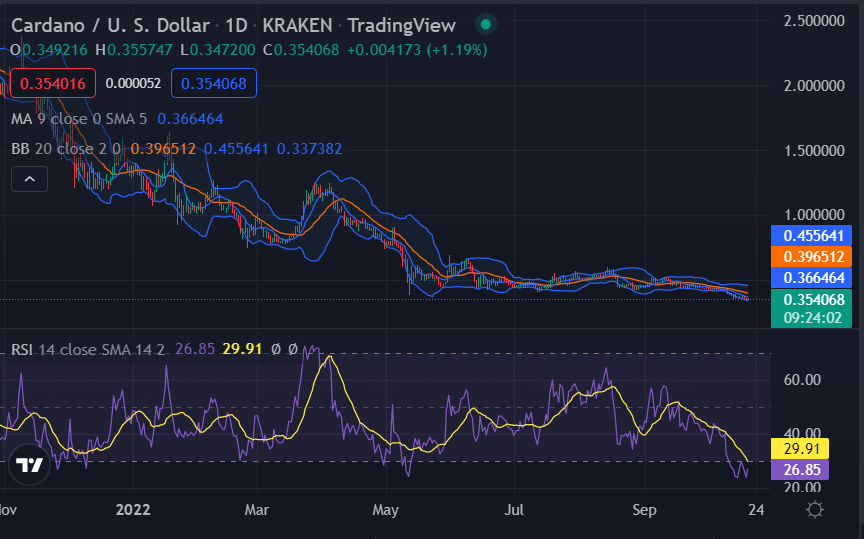
Cardano price analysis is going through a loss as the price underwent a decline up to $0.3532 today. The downtrend has been quite constant for the last two days, and even today, the price has followed a downward movement. The reversal in trends had been quite unexpected as the bulls were leading previously. Nonetheless, the bears have taken charge once again, and the price has been devalued. The Cryptocurrency is down by 0.53 percent, with a trading volume of $395 million and a market capitalization of $12.16 billion.
ADA/USD 1-day price chart: Bearish swing deflates price levels to $0.3532
The bearish momentum has been intensifying according to the one-day Cardano price analysis. The price has been downgraded to $0.3532 as a result of the constant downflow. The past few days have been quite discouraging for the cryptocurrency as a strong bearish trend was going on. Similar trends have been reported during the last 24-hours as well. The price has gone below the moving average (MA) value as well, which is standing at $0.3664.

The volatility is increasing, which means that the downswing might last for the next coming hours as well. If we discuss the Bollinger bands Indicator, then its upper value is at $0.3540, and the lower one is at the $0.3480 position. The Relative Strength Index (RSI) score has been lowered to 29.91 as well.
Cardano price analysis on a 4-hour price chart: Bearish depression results in collapse below $0.3532
The 4-hour Cardano price analysis is showing signs of bearish momentum as the price decreased quite significantly. The price has been declining consistently as the cryptocurrency is showing a downward tendency. A reduction in price has been recorded in the last four hours as well as the price levels moved down to $0.3532. Moving on, the moving average indicator is showing its value at $0.3546 at the time of writing.

The volatility has increased because of the bearish slope, and the Bollinger bands are expanding. The upper Bollinger band is standing at $0.3587, the lower Bollinger band is at $0.3486, and the overall average is being maintained at $0.3530. The RSI score dropped drastically to 35.01 as well, quite near the undersold zone.
Cardano price analysis conclusion
The one-day, as well as the four hours Cardano price analysis, predicts that a downtrend has been following since last week. The bears are leading the game at the moment, and the price levels have been brought down to $0.3532 as a consequence. A Further downfall can be expected as the bears have been dominating for the past few hours as well. The price has been persistently moving down, which means that chances of improvement for the bulls are still on the limited side.
Disclaimer. The information provided is not trading advice. Cryptopolitan.com holds no liability for any investments made based on the information provided on this page. We strongly recommend independent research and/or consultation with a qualified professional before making any investment decisions.


