
The recent Cardano price analysis reveals that the ADA market has been bullish, as the crypto market has posted some positive gains in the past 24 hours. The bulls pushed the price of ADA back above $0.40 and found resistance at $0.4116. Since then, the coin has gained over 2.56%, with the price currently at $ 0.4024.
ADA/USD is currently facing resistance at the $0.4116 level, whereby if broken, it could lead to further upward momentum for ADA prices. The buyers need to ensure that the price remains above $0.40, as it could be a strong support level for ADA prices, especially if the bears regain control over the market.
The 24-hour trading volume for LTC has increased, showing more market participation in the coin as it currently sits at $470 million. Cardano’s market cap currently sits at $13.9 billion, an increase of 2.56%, making it the seventh-largest cryptocurrency by market cap.
Cardano price analysis 1-day chart: Bulls lead ADA/USD to $0.4024
The 1-day chart for Cardano price analysis shows that the bulls have been in control since pushing back above $0.40, as the price is currently trading above the 20-day and 50-day moving averages. The buying pressure needs to remain firm and ensure the price remains above $0.40 as ADA could eye to break the resistance at $0.4116.

On the technical indicators, the MACD is currently bullish, showing buyers are pushing for more gains as the moving average line has crossed above the signal line. On the histogram, the green bars are increasing, showing that the trend still favors the bulls. The RSI currently sits at 61.75, suggesting some buying pressure is present, but buyers need to be wary as the price could test the support levels at $0.3887 if the bears regain control over the market. The moving average (MA) is trending upwards, as the green candlesticks show that the bulls are in control.
Cardano price analysis 4-hour chart: Recent developments and further indications
The hourly Cardano price analysis shows a battle between the buyers and sellers as they attempt to push the price in their favor. ADA is trading in a range of $0.40 to $ 0.41, and the buyers need to ensure they don’t let the price slip back below $0.40, as it could be a strong support level for ADA prices.
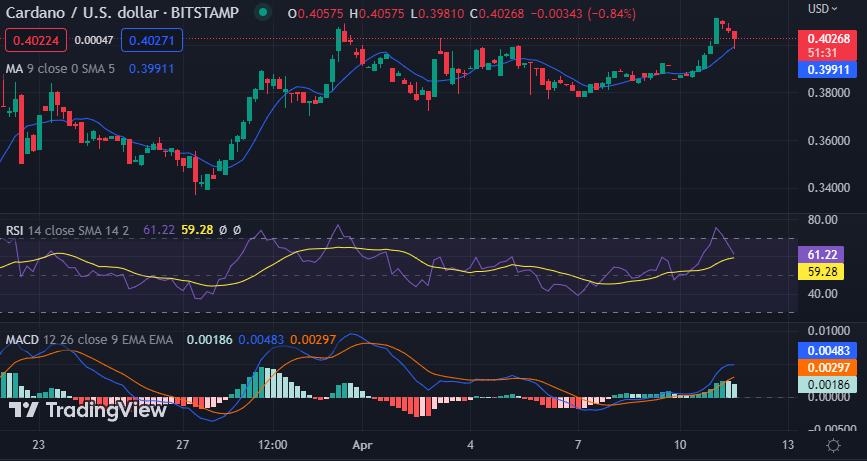
The MACD is still bullish on the technical indicators, with the signal line below the moving average line. The histogram shows that the buyers are pushing for more gains, but they must remain cautious as a sudden bearish move could reverse the trend. The RSI is currently at 61.22, indicating that the buyers have room to push the price higher as the indicator slopes to the south. The moving average (MA) is still trending upwards, but red candlesticks are forming on the chart showing that the bears may be gaining traction.
Cardano price analysis conclusion
Overall, ADA is showing some bullish signs as the recent Cardano price analysis reveals that the buyers are attempting to push the price back above $0.40 and gain more momentum in the market. The bulls need to ensure they don’t let the bears take control, as a sharp sell-off could lead to a retracement in the price of ADA.


