Cardano price analysis shows a bearish trend in the market as ADA slides to a low of $0.358. The short-term trend for Cardano is bearish and sellers are likely to remain in control as long as the price of ADA remains below $0.36 after crashing from the resistance of $0.37. The next strong support for Cardano is found at $0.3559, which managed to hold back price declines during previous sessions. The ADA is down by 1.93% on the day and appears to be losing momentum as it heads into a bearish trend.
Cardano price analysis 1-day price chart: ADA/USD gains momentum at $0.358
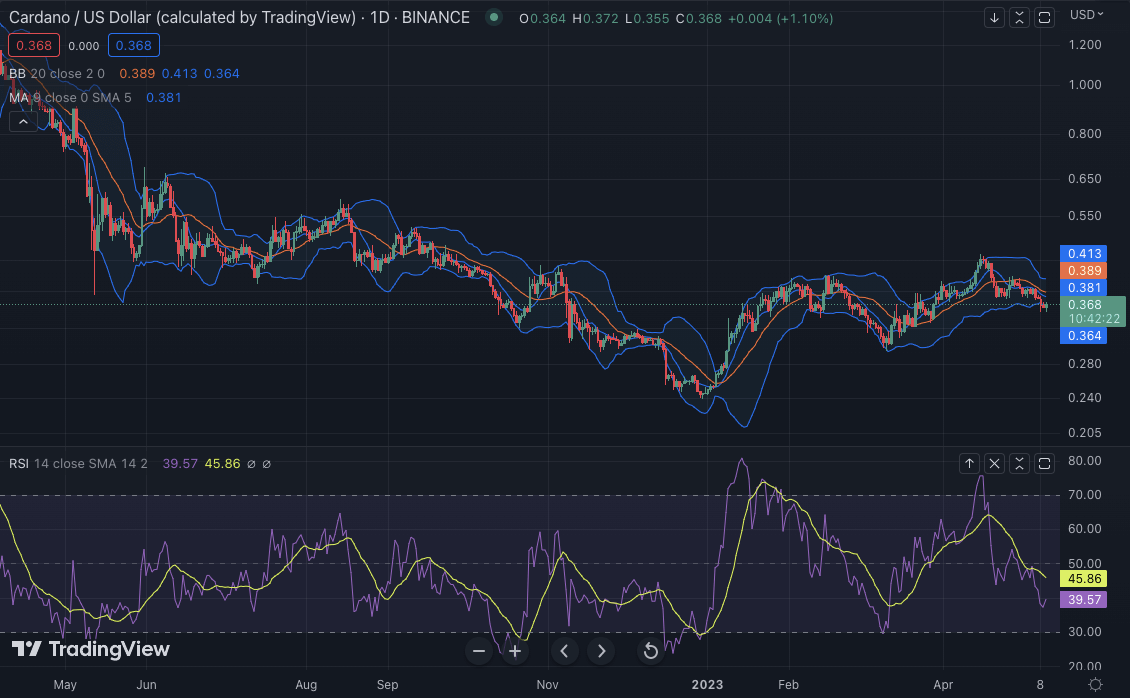
The 1-day price report for Cardano price analysis also demonstrates bearish momentum because the bears are successfully maintaining their advantage. The ADA value has somewhat declined over the last couple of hours; at the time of writing, it is $0.358 and is now appearing to be declining.

The moving average (MA) in the 1-day chart stands at $0.381 below the price level. The Bollinger band ends are moving in a straight direction after converging steeply and forming a narrow tunnel, indicating low volatility, with the top end at the $0.413 mark and the lower end at the $0.364 mark, respectively. The Relative Strength Index (RSI) is also moving down to 39.57 points, just below the 40 mark, indicating a bearish trend in the market
Cardano price analysis 4-hour chart: Next resistance at $0.3673 which bulls need to break
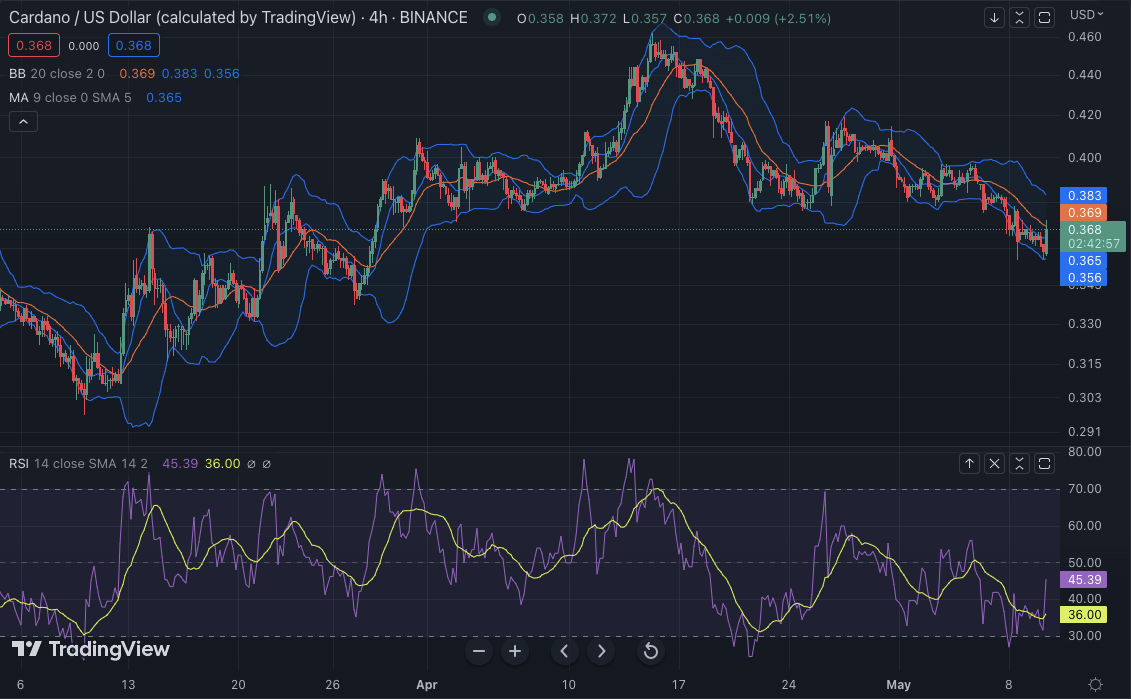
The 4-hour Cardano price analysis shows that the price level will continue to drop as long as bears maintain their dominance. The ADA value is fluctuating around $0.358 after going through some degree of fall in recent hours.

The MA is currently standing at $0.365 below the price level, signifying that the bears are likely to remain in control until they break the resistance of $0.3673. The Relative Strength Index (RSI) stands at 45.39 points, indicating a bearish trend in the market and making it difficult for buyers to take control in the near future. The Bollinger bands on the hourly chart are trending in a sideways direction, indicating low volatility. The upper Bollinger band is standing at $0.383 and the lower Bollinger band stands at $0.356, respectively.
Cardano price analysis conclusion
Overall, the Cardano price analysis shows a bearish trend in the market as ADA slips to $0.358. The selling pressure is likely to remain strong as long as the price of ADA remains below the resistance at $0.3673. The next support level for Cardano is found at $0.3559 and if buyers are able to break this level, we could see a significant surge in the ADA market. Both hourly and daily technical indicators are also in a bearish zone. This suggests that the bears are likely to take control in the near future, and buyers will have to struggle to get back in control of the market.


