Dogecoin price analysis for today shows an uptrend in the market, with the coin rising from a low of $0.072 to a high of $0.07591 over the day. The bullish sentiment in the market has been driven by increased buying activity, as investors are optimistic about the future potential of Dogecoin. The resistance level for DOGE/USD is at $0.07748 and the support level is at $0.07086 and has seen a slight price increase of 3.97 percent in the past 24 hours. The 24-hour trading volume currently stands at $514 million. The coin is currently trading around the $0.07591 level and has seen an increase of 3.97% in the past 7 days. The market cap of Dogecoin is currently at $10.01 billion and has seen a slight increase of 3.49% in the past 24 hours.
DOGE/USD 4-hour price chart: Bulls stumble to keep control
The 4-hour Dogecoin price analysis favors the bullish side as a strong rise in DOGE/USD value was detected in the past few hours. The four-hour price chart, which shows green candlesticks signaling an increase in coin value, confirms this. According to the positive momentum, the price has effectively recovered over the $0.07591 margin, and it appears that the bulls will hit their next objective soon.
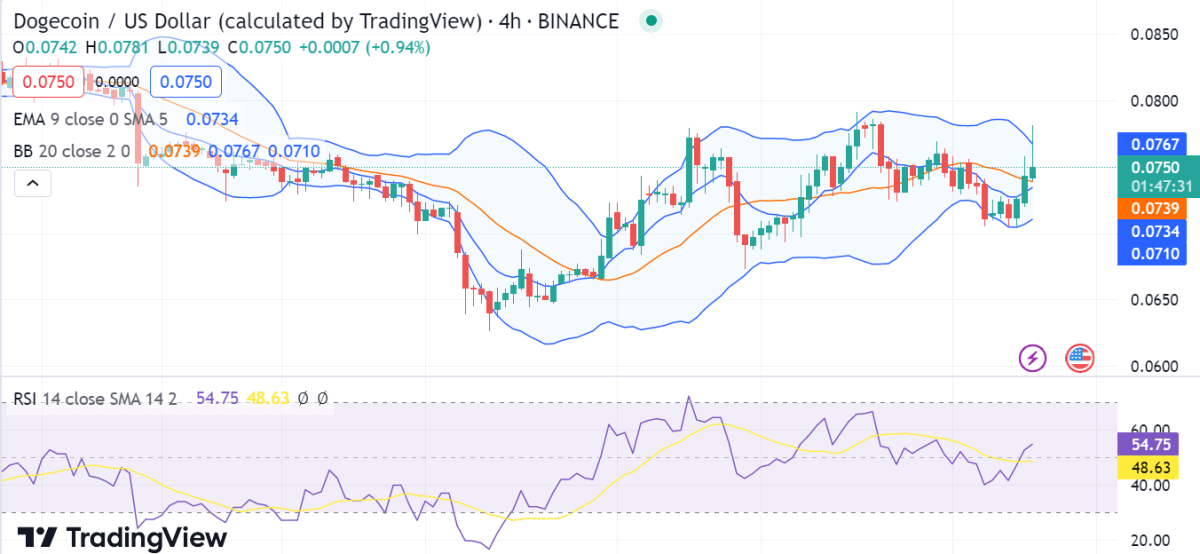
The DOGE/USD pair shows that the 20-day EMA is above the 50-day EMA, which is another confirmation of the bullish trend in the market. This indicates that the bulls are gaining strength and will likely push prices higher soon. The Bollinger bands are also indicating a bullish trend as the upper band is at $0.0767 and the lower Bollinger band is at $0.0710, which means that the market has strong upward momentum in this range. The relative strength index (RSI) is currently at 48.63, indicating that the market is oversold.
Dogecoin price analysis 1-day chart: Prices for DOGE/USD surged to $0.07591, displaying bullish enthusiasm.
Looking at the hourly Dogecoin price chart one can see that the price is in an upward trend as it is trading above the $0.0024 level and has formed a bullish flag pattern. The bulls have been in control of the market since today morning, and the price has found strong support at this level. The volatility in the one-day price chart is still at the lowest level and it is a sign of a very stable uptrend.

The upper limit of Bollinger’s band is present at $0.0801, which serves as a resistance point for DOGE. Conversely, the lower limit of Bollinger’s band is currently at $0.0657, which serves as another support point for DOGE. The 20-day EMA is also above the 50-day EMA, which points to a strong uptrend in the near future. The relative strength index (RSI) is currently at 39.11, which shows a slight increase.
Dogecoin price analysis conclusion
Overall, Dogecoin has seen a positive trend over the past few days and is expected to continue its upward trajectory as more investors enter the market. The bullish current is expected to intensify in the upcoming hours as bulls aim to push the price toward $0.07591 or higher. Therefore, the overall outlook is bullish, and traders should look for buying opportunities in the near future.