
According to the most recent Dogecoin price analysis, the bullish side has made a strong comeback after the price unexpectedly surged past $0.0760. The good news is that by acquiring more assets, buyers can solidify their market position. Because of the strength of the momentum, it also passed the moving average (MA), or $0.0749. If the price levels keep going upward, a further increase in price levels is anticipated.
DOGE/USD 1-day price chart: Cryptocurrency overcomes obstacles to achieve $0.0769
The 1-day price chart showing Dogecoin price analysis is highly supportive for DOGE/USD. The price levels have picked up speed, and the bears are still fighting to reclaim the upper hand. The price levels have hit $0.0769, which represents a significant improvement over the previous week’s bearish trends. If the present price level is compared to the moving average (MA), which is $0.0749, the moving average has fallen behind. The short-term trend line is moving upward, and cryptocurrency patterns in the future are anticipated to be positive.

The upper Bollinger band has hit $0.0784, while the lower band has also reached $0.0705, as volatility for the bulls continues to decline. The Bollinger bands’ convergence suggests that future market fluctuations will be small. The neutral range’s center line has been crossed by the Relative Strength Index, which is presently showing a value of 52, indicating market buying activity, but its curve has flatten out indicating at selling pressure also building up.
Dogecoin price analysis: Recent developments and further technical indications
The price of Dogecoin increased dramatically today, breaking upwards and reaching a peak of $0.0788, according to the 4-hour Dogecoin price analysis, but the price reverted back shortly after. The bears have been unable to defeat the bulls yet due to their overwhelming progress, however, bears hasve taken the lead at the time of writing. The price levels are still significantly greater than the $0.0757 MA value. The SMA 20 curve has crossed above the SMA 50, which is a bullish indication for the market.
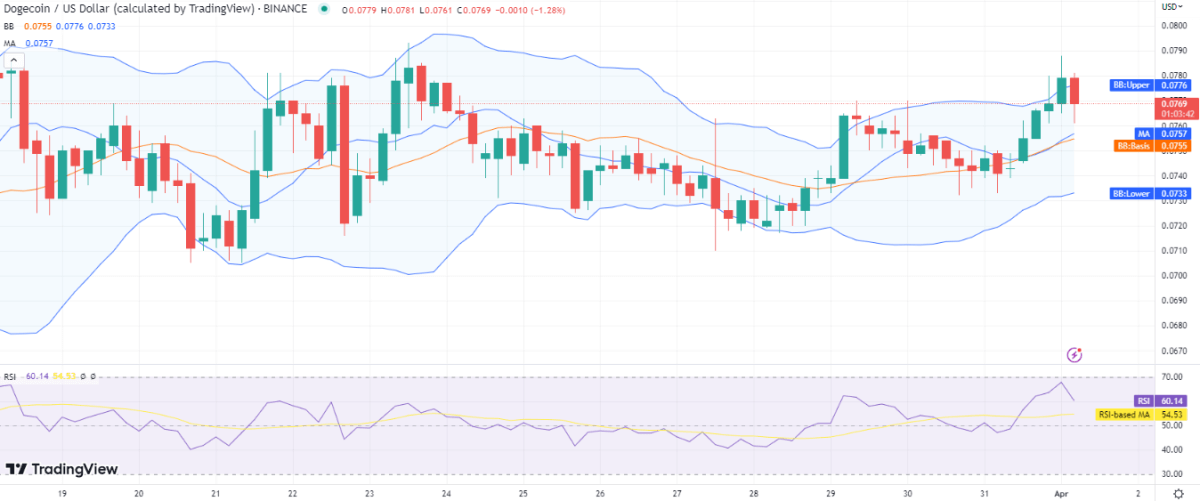
The RSI score is also going down again and is right now at 60, whereas the Bollinger bands average value is also present at $0.0755 level in the 4-hours price chart. The upper and lower Bollinger bands have hit values of $0.0776 and $0.0733, respectively, as the volatility is increasing.
Dogecoin price analysis conclusion
A further increase in the DOGE/USD price can be forecasted if the winning pattern continues, according to the Dogecoin price analysis presented above. If purchasers keep flooding the market, price levels are predicted to rise above $0.0769. Only if the support level at $0.0756 remains unchanged. At the same time, bears are also progressing and reversal in trends can also be expected.


