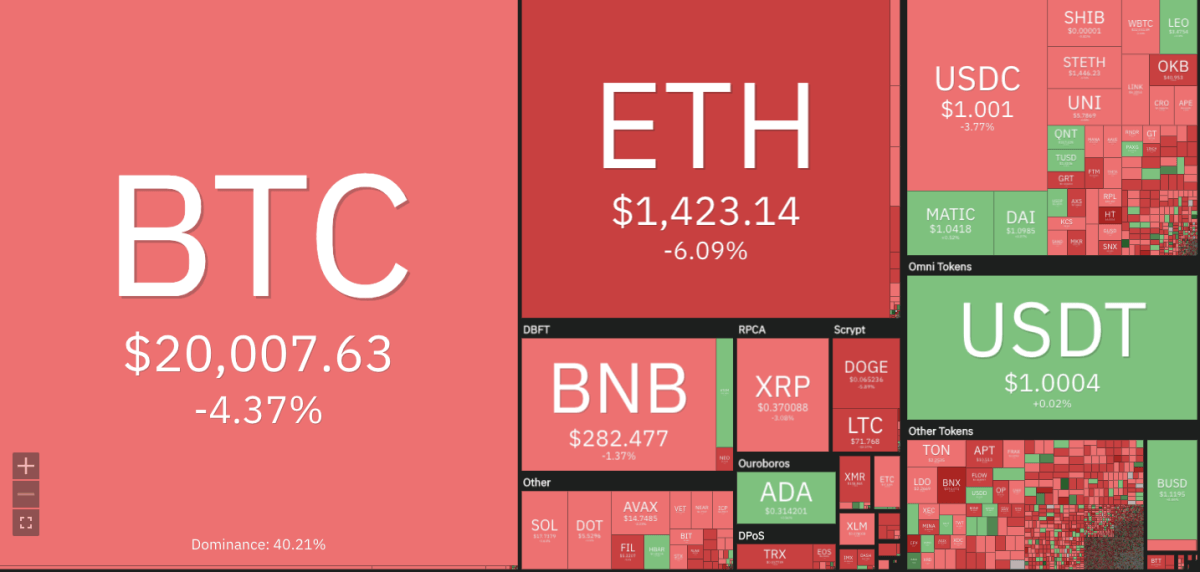
The latest Ethereum price analysis indicates a strong bearish sentiment in the market. ETH/USD pair has been on a downward trajectory since the start of this month and is now nearly 10% down from its all-month-time high of $1,585. The market crash that occurred a few weeks ago has led to a continuous bearish sentiment for Ethereum. This downward trend is further accelerated by the lack of significant buying interest in the market, which is leading to lower demand for ETH.

The downside pressure of Ethereum is still strong, and if this trend continues, the price could drop to even lower levels. On the upside, the resistance of $1,488 may provide some support for ETH. However, if it fails to hold above this level, then we can expect further losses in the coming days.
The miners and the holders of Ethereum are currently feeling the impact of the bearish market. Miners, in particular, are facing a difficult situation as their profits have been declining due to lower mining rewards caused by increased difficulty levels and reduced transaction fees. Holders have transferred their assets from Ethereum to other cryptocurrencies, which has further contributed to the bearish sentiment.
Ethereum price analysis 1-day chart: ETH trades in a bearish zone
The one-day Ethereum price analysis is confirming a decline in coin value, as the price has been following a bearish trend for the day. The price has been rangebound between $1,400 and $1,500, and the lower support at this level keeps getting violated. As of now, the Ethereum price is hovering around the $1,423 mark, and the bearish trend is likely to continue in the coming days. The pair has lost more than 5.87% of its value in just a day, and if the selling pressure continues, then we may soon start seeing ETH going toward the $1,378 support level.

The moving average (MA) is still quite low and is present at the $1,540 mark. This indicates that the bearish pressure is still in play, and if ETH doesn’t hold above this level, then we could see further losses for Ethereum. The SMA 50 curve is traveling above the SMA 20 curve as the bearish trend is evidently getting stronger. The increase in volatility has taken the upper Bollinger band value to $1,742 and the lower Bollinger band value to $1,452. The Relative Strength Index (RSI) score has moved down to the 37.96 level.
Ethereum price analysis: ETH price backtracks to $1,405 as bears gain momentum
The hourly Ethereum price analysis is still on the bearish side, as ETH has been declining slowly and steadily since yesterday. The market opened trading at $1,5431 and has been on a downward trend since then. The market has formed a descending triangle pattern, and the price has broken down from the upper trendline, which signals further bearishness in the ETH market.

The 50-moving average is currently placed near the $1,145 mark, and the 100-moving average is sitting at the $1,450 mark. The 200-moving average has been moving away from the 50-MA to signal a bearish momentum in the market. The volatility is still high, and the upper Bollinger band value is currently at $1,629, while the lower Bollinger band value is at $1,382. The Relative Strength Index (RSI) score is at the 25.65 level, which shows that the bearish forces are gaining more strength in the market.
Ethereum price analysis conclusion
Overall, Ethereum price analysis signals a bearish sentiment in the market, and ETH/USD pair is expected to continue its downward trajectory toward the $1,378 support level. The bulls will have to gather enough strength to push the price up before it is able to break above the $1,488 resistance level. If that doesn’t happen soon, then we might see Ethereum going even lower in the coming days.
While waiting for Ethereum to move further, see our Price Predictions on XDC, Cardano, and Curve.


