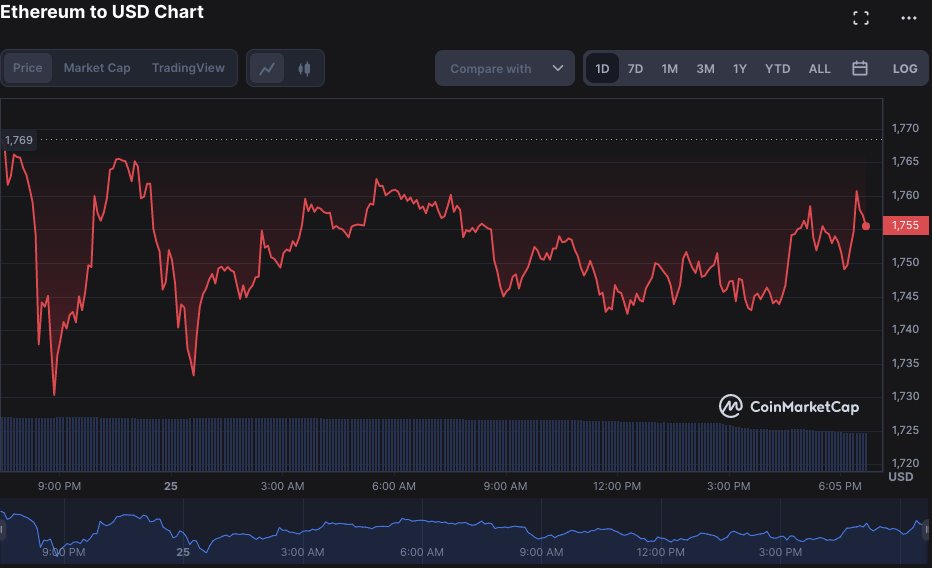
Ethereum price analysis shows the price function is facing bearish resistance once again after the bearish trend returns to the market. The price has receded back to the $1,755 level during the last 24 hours, and it is expected that it will go through a further decline in the coming hours. There have been constant changes in trends as ups and downs can be seen in the price movements over the past days, with the balance of power favoring the bearish side, and today the bears are again in the leading position. The chances are getting dim for the bulls to find recovery today, and the coin may soon dip into the $1,730 range.

The bullish sentiment was seen in the market the previous day before when it surged ahead and went above the $1,770 mark, but now that resistance is preventing further upward movement and the bears are taking control. However, the bears may also reach an exhaustion point and a new wave of bullish sentiment may follow in the coming days.
Ethereum price movement in the last 24 hours: ETH forms a bearish trend
The 24-hour market analysis for Ethereum price shows a bearish trend with the coin going down from $1,755 with a loss of 0.65 percent in the last 24 hours. The cryptocurrency has formed a pattern with lower highs and lower lows, indicative of a bearish trend. The coin’s price action is currently stuck between $1,730 and $1,770, and it is essential to break this range for the coin to make significant progress in its price action. Despite bearish pressure, the coin still has some potential to surge ahead, and traders should be alert for any signs of bullish momentum.
The 24-hour volume of the coin has been relatively moderate and is now at $7,963,075,760. On the other hand, the market capitalization is at $215,252,201,382 and a circulating supply of 122,373,866 ETH.

Looking at the technical indicators, the MACD is still in the bearish zone as the signal line (orange line) is currently above the MACD line (blue line). The Relative Strength Index (RSI) is also in bearish territory and stands at 56.10, indicating that the coin is currently facing downward pressure. The moving average indicator (MA) in the one-day price chart shows its value at $1,772, which is above the current price, but it may soon cross below the SMA 50, which will be a bearish indication.
Ethereum price analysis 4-hour chart: ETH is facing resistance at $1,770
The 4-hour chart of the Ethereum price analysis shows the coin has been struggling to break through the resistance level of $1,770 after it was rejected when it went above this level. Currently, the coin is trading in a bearish pattern as the bears have taken control, and it is expected that the price may go down further in the coming hours. The MACD indicator is in the bearish zone as the histogram is in red, and the signal line (orange line) is currently below the MACD (blue line).

The moving average is trading at a $1,755 position in the 4-hour chart. The SMA 50 curve is trading above SMA 20, confirming a major bearish pressure on the cryptocurrency. The Relative Strength Index (RSI) score is in the lower neutral range at an index of 46.64, which is still a good score, but the slight downward curve of the indicator hints at the selling activity in the market.
Ethereum price analysis conclusion
The Ethereum price is currently going through a major bearish phase, and the chances of recovery are getting slimmer with each passing hour. The technical indicators show that the coin is likely to continue its downward momentum in the coming hours unless there’s a sudden surge in bullish sentiment. The selling pressure is high, and the coin needs to break through the $1,770 resistance level for any significant progress in its price action.
While waiting for Ethereum to move further, see our Price Predictions on XDC, Cardano, and Curve.


