The Ethereum price analysis reveals the coin is in bearish territory. The ETH/USD pair is trading at $1,588, a decline of 3.53%. The coin’s price breakout was upward at the start of the trading session, but the gains were nominal. As the selling pressure is again, the ETH price function has been headed downward for the last 24 hours.

Ethereum price is facing resistance at $1,661, which is a crucial level for the bulls to break. A jump above this level could push the price up to $1,600. On the lower side, support is at $1,583; if it fails, ETH price may plunge below that level, leading to more losses in the near term.
The 24-trading volume of Ethereum has fallen to $8,475,951,879, and the market cap of ETH is at $194 billion, making it the second-largest cryptocurrency in the world.
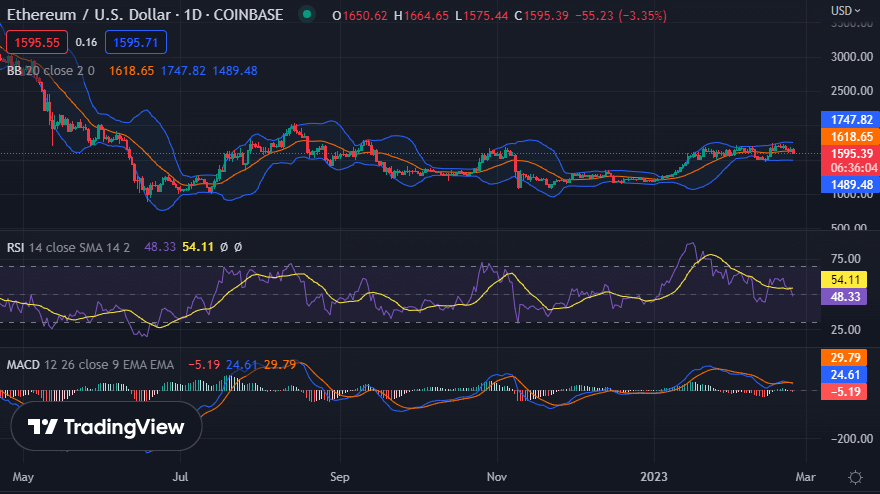
ETH/USD 1-day price chart: Bears are struggling to sideline bulls as ETH/USD trades below $1,600
The 1-day price chart for Ethereum price analysis shows the bears have hindered the upwards price movement and decreased the price below the $1,600 level. As the bearish pressure is comparatively high, bulls cannot move any further in their endeavor. Currently, the coin is trading at $1,588 at the time of writing, still reporting a loss of around two percent during the last 24 hours, which proves bearish supremacy in price trends.
The volatility is still low, giving no clear direction to the market. The Bollinger bands in the chart show that the price is trading in a tight range. The upper Bollinger band is at $1,747.82, which may act as the resistance level, and the lower band is at $1,489.48, which may act as a support level.

The RSI is slightly above 50, so it suggests that there is still room for more bearishness in the market. The MACD indicator is in the bearish zone as it is trading below zero. The signal line and histogram are above the 0-level, meaning that the buyers have not yet stepped into action with their buying pressure.
Ethereum price analysis: Bearish pattern forms as at $1,588
The 4-hour price chart for Ethereum price analysis shows the price is still struggling to stay above $1,600. The buyers are expected to push the price above this level in order to make a move towards higher levels. However, the selling pressure is still dominating the market, as a bearish pattern is forming. The bearish pattern is a sign of more losses in the near term.

The hourly indicators are painting a bearish picture. The RSI is below 50, and the MACD line has crossed beneath the signal line, indicating that bears are in control of the market at this moment. Moreover, the hourly chart shows that $1,583 is a very important level to watch out for, as it might act as support if the ETH price dips further down. The Bollinger bands’ upper Bollinger band and low Bollinger band are at $1,687.34 and $1,602.03, respectively. This indicates that the price is moving in a tight range.
Ethereum price analysis conclusion
The Ethereum price analysis indicates that the selling pressure dominates the market, and the ETH/USD pair is still trading below $1,600. The bearish pattern formation in the chart suggests that more losses may come in the near term if bulls fail to push prices above this level. Further, support for Ethereum remains at $1,583, and a break below this level could lead to further losses in price.


