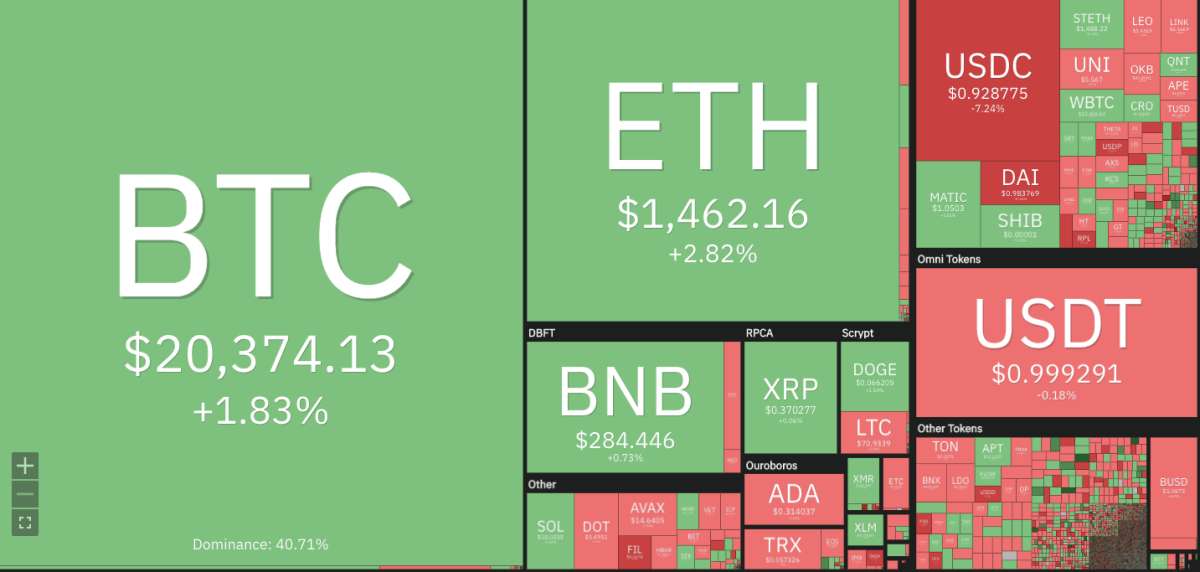
Ethereum price analysis for today shows ETH has been consolidating around $1,403.96 to $1,450 in the last 24 hours. The current price of Ethereum is $1,403.96, and the 24-hour volume is at $14.5 billion. On the downside, key support levels lie at $1,400 and $1,350 if the bulls fail to defend the lower boundary of the range. A break below this zone could spark further losses toward $1,200.On the upside, if the bulls manage to push the price beyond $1,500 and gain strength above this level, there is a chance of Ethereum trading toward the next resistance levels at $1,600 and $1,700. However, for this scenario to play out, ETH will first have to break above the $1,480 resistance.

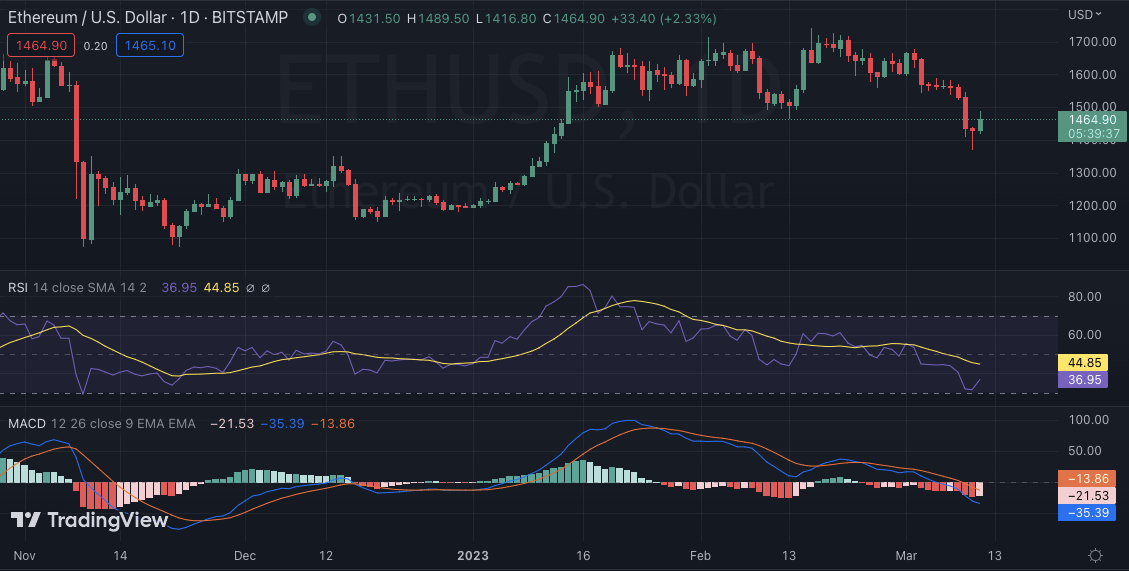
Ethereum price analysis on a daily chart: ETH/USD fails to break above the triangle pattern
Ethereum price analysis on a daily chart indicates ETH has remained above $1,400 for most of the day, trading inside a triangle pattern with resistance at $1,500 and support at $1,400. The Relative Strength Index (RSI) is indicating that the bulls have the upper hand with a reading of 53. However, it remains to be seen if they can break above the triangle resistances in order to take Ethereum’s price higher. On the downside, the triangle pattern indicates that if Ethereum fails to break above $1,500, it could drop below $1,400 and potentially trend lower toward $1,300.

Ethereum fell below a two-monthly low, a level that was seen as critical for the bulls’ attempt to break above $1,500.The SMA 50 is providing support near the $1,400 level, and any break to the downside will likely be supported by this indicator. The MACD also indicates a bearish bias in Ethereum’s price.
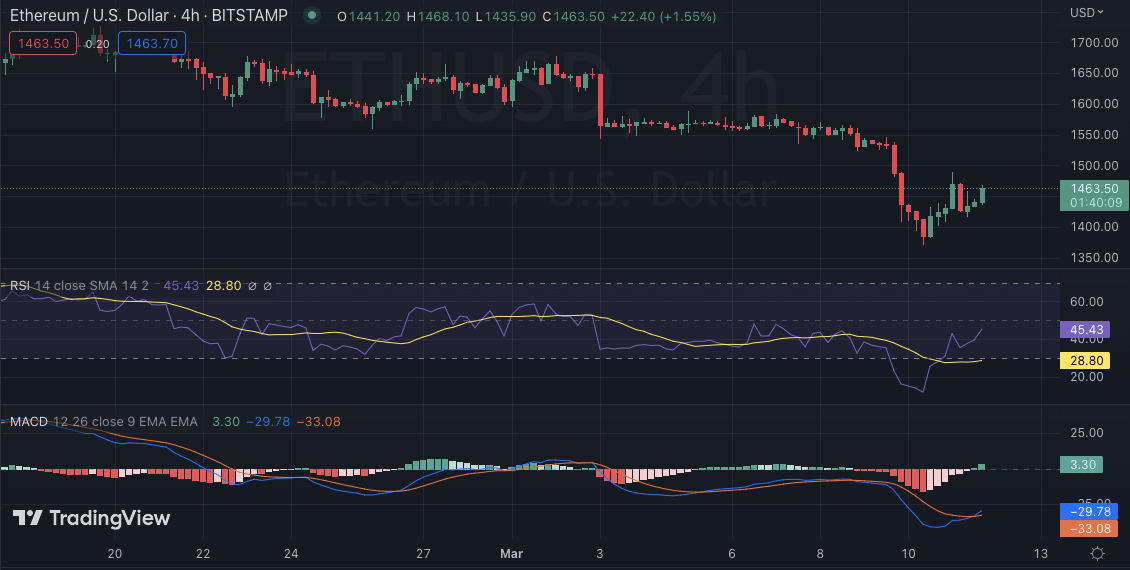
ETH/USD 4-hour chart analysis: Bulls attempt to break above $1,500
On the 4-hour chart, Ethereum price analysis on a 4-hour chart indicates ETH/USD has been trading within a range-bound channel, and bulls have attempted to break out higher but failed. The price is currently trading below the 20-period Exponential Moving Average (EMA), which indicates a bearish bias, while the RSI is starting to rise, possibly indicating a possible bullish trend.

The Moving Average Convergence Divergence (MACD) has shifted to the bullish side, confirming a potential trend reversal. The next major resistance level is at $1,500, and a break above this level could mark the start of a new uptrend for Ethereum. On the downside, if Ethereum fails to break out of the range-bound channel, then it could drop below $1,400 and potentially trend lower toward support levels at $1,300 and $1,200.
Ethereum price analysis conclusion
In conclusion, Ethereum price analysis reveals that ETH is currently trading near the lower boundary of a triangle pattern with resistance at $1,500 and support at $1,400. If Ethereum can break out above the triangle pattern, then it could trend higher toward levels at $1,600 and $1,700. Conversely, a break to the downside could see Ethereum testing levels at $1,300 and possibly even lower.
While waiting for Ethereum to move further, see our Price Predictions on XDC, Cardano, and Curve


