

Ethereum has been making a fresh attempt at recovery recently. Here’s what on-chain data suggests regarding if this run can be sustainable or not.
Ethereum Network Growth And Utility Have Both Gone Up Recently
According to data from the on-chain analytics firm Santiment, the ETH blockchain has displayed an encouraging trend in Daily Active Addresses and Network Growth recently. These two indicators are used to track the utility and growth of the chain.
The “Daily Active Addresses,” the first of these, measures the unique number of addresses that are taking part in some kind of transaction activity on the blockchain every day.
This unique number of addresses can be considered analogous to the unique number of users participating on the network, so the indicator’s value can provide hints about the strength of traffic Ethereum is witnessing at the moment.
The other indicator of interest here, “Network Growth,” tells us about the daily number of addresses making a transaction on the blockchain for the first time.
Generally, such new addresses correspond to fresh investors coming into the cryptocurrency, so the Network Growth’s value can provide hints about how the adoption of the asset is coming along.
Now, here is a chart that shows the trend in the Ethereum Daily Active Addresses and Network Growth over the last few months:
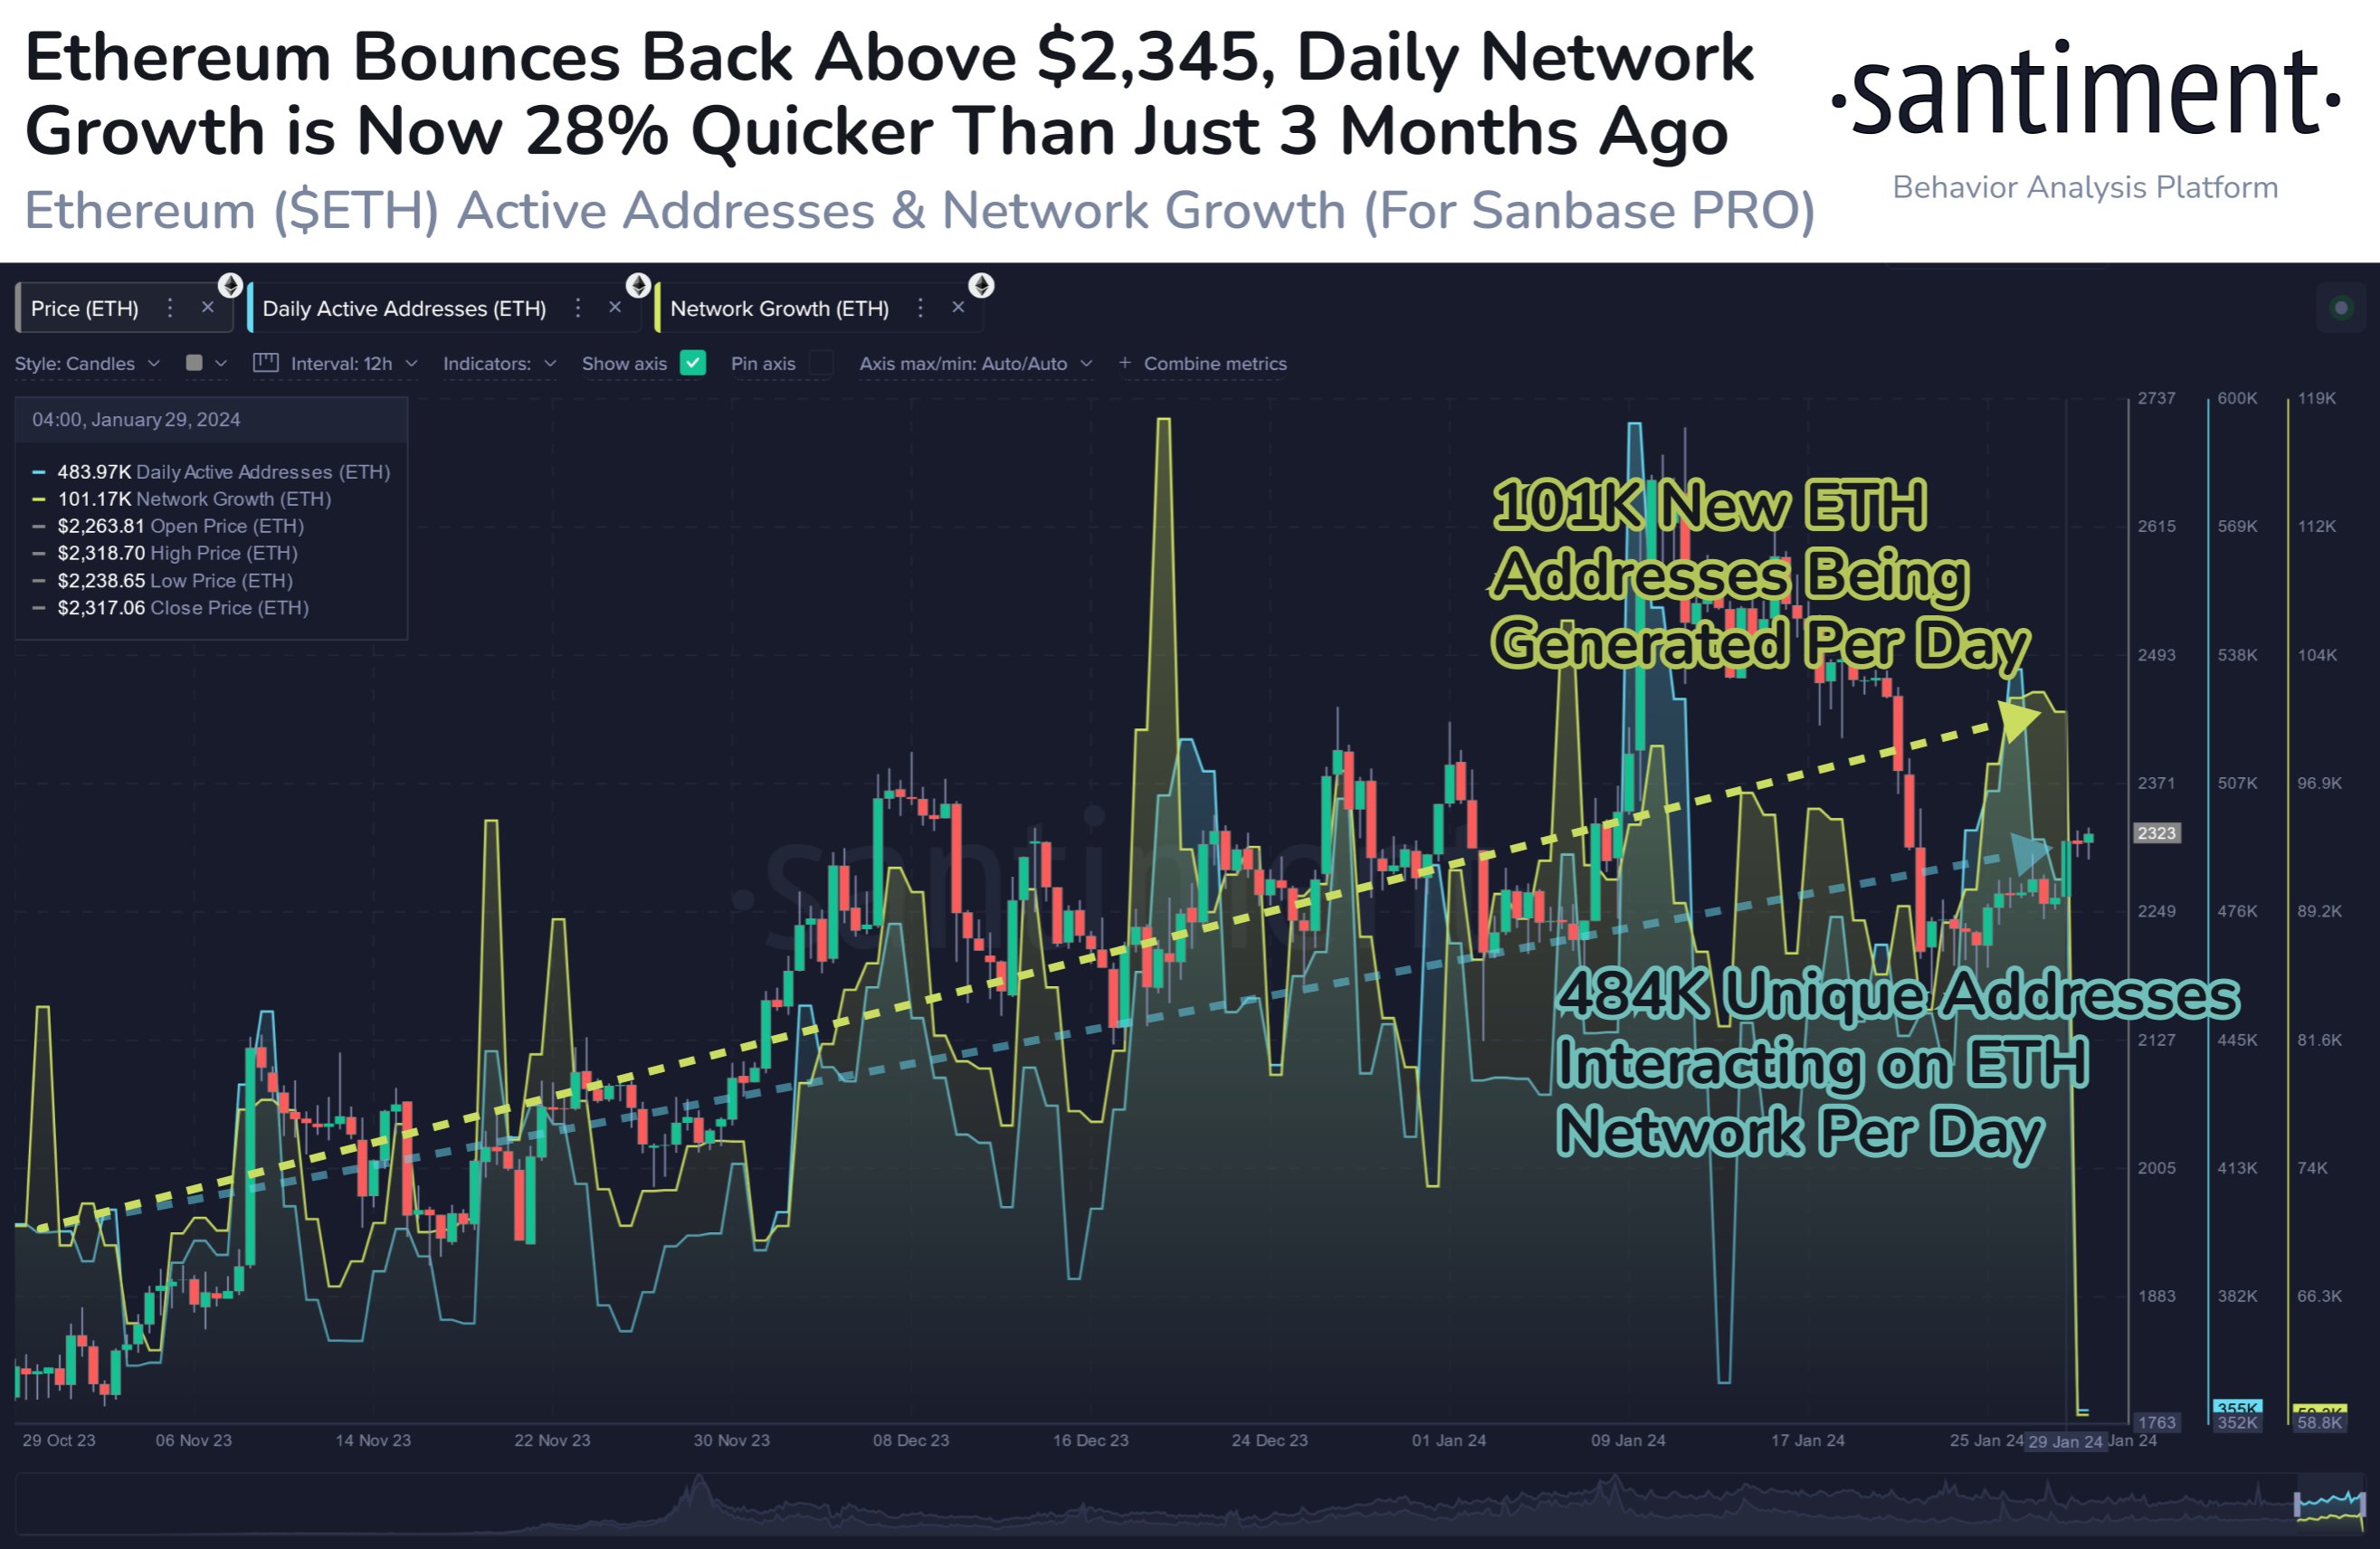
From the graph, it’s visible that both the Daily Active Addresses and Network Growth have steadily been going up for Ethereum recently. After the increase, the chain is now observing 101,000 new addresses popping up daily and 484,000 unique addresses making transactions per day.
This suggests that not only is the cryptocurrency observing significant interest from the existing users (as they are making moves on the network), but also from fresh investors. “Increased utility is a primary pillar to justify an increasing ETH market cap,” notes Santiment.
The on-chain analytics firm Glassnode has discussed the activity occurring on the Bitcoin blockchain in its latest weekly report. Here is the chart shared by Glassnode that reveals the trend in the 7-day moving average (MA) number of active entities for the original cryptocurrency:

This metric is similar to the Daily Active Addresses, except it keeps track of the “active entities” instead of the addresses. An entity refers to a group of addresses that Glassnode has deemed to belong to the same investor.
As is apparent from the chart, the active entities have plunged to cyclical lows for Bitcoin recently. This is unlike what Ethereum has been observing, where the utility has appeared to be on the rise.
The analytics firm explains, however, “at face value, this might suggest that despite the significant price appreciation, growth in Bitcoin users has not followed suit.”
“This is largely a result of the uptick in activity related to Ordinals and Inscriptions, where many participants are re-using Bitcoin addresses, and reducing the number of measured ‘active entities’ (does not double count).”
ETH Price
Ethereum has been making an attempt at recovery recently, but the coin has plunged during the past day, bringing the asset’s price down to around $2,300. Given the strong network activity, though, it’s possible the rally could still have hopes of continuing.