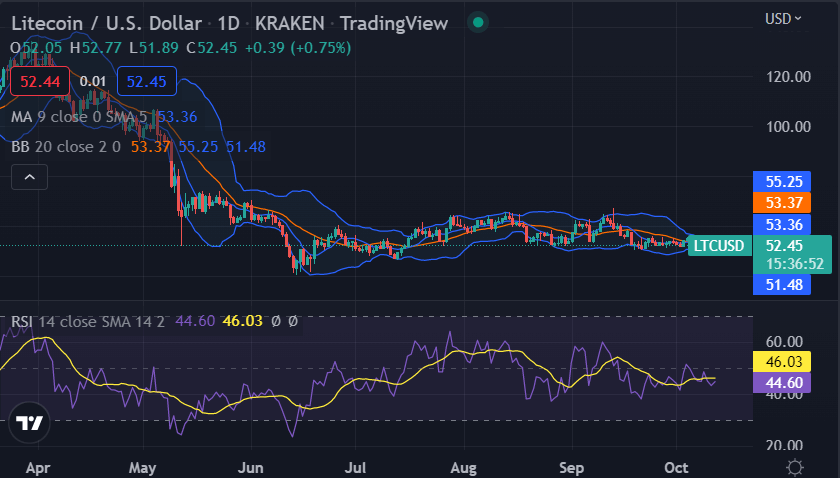
Litecoin price analysis predicts an increasing trend for cryptocurrency today. Although the price was facing bearish resistance earlier, the bulls have managed to bring the price to $52.47 in the last 24 hours. The continuation of the green candlestick indicates that the coin value has started to increase once again for a day. The LTC/USD pair faces resistance at the $52.72 level. A break above this resistance level would confirm the bullish trend and open up the possibility for further gains toward the $52.85 and $53.00 resistance levels.
On the downside, support for the LTC/USD pair is seen at the $51.94 level. A break below this level could see the pair retrace toward the $51.64 support level. The Litecoin price is currently trading in a bullish trend as the bulls push the price higher. The 24-hour trading volume is $326 million, and the market capitalization is $3.74 billion.
LTC/USD 1-day price chart: Upside continues as price targets next aim above $52.47
The one-day Litecoin price analysis is showing a strong bullish trend for the day as the buying momentum seems to be intensifying. Green candlesticks are marking the one-day LTC/USD price chart, which is indicative of an increasing trend. Currently, the coin value is $52.47, and it is highly expected that it will reach a higher goal in the upcoming days. The coin has already gained 1.04 percent overnight, which is a big achievement for the bulls; however, the coin is still at a loss of 2.17 percent if observed over the past two days. The moving average (MA) is now standing lower than the current price, i.e., $52.45.

A crossover between SMA 20 and SMA 50 curves is taking place, which is a huge bullish indication and a great accomplishment for buyers. Moving on to the Bollinger Bands Indicator, the upper value is at $52.72, whereas the lower value is at $51.94. The Relative Strength Index (RSI) graph shows an upward curve as the score just heightened up to 46.03.
Litecoin price analysis 4-hour price chart: Bulls push for higher prices
On the 4-hour Litecoin price analysis chart, we can see that the market has been in a bullish trend since the beginning of the day. For the last 4 hours, the market has been on an uptrend as bulls push for higher prices. The Bearish Engulfing candlestick pattern that formed yesterday has been invalidated as the market moved higher. The moving average value in the four-hour price chart is standing at the $52.12 level after crossing above the SMA 50 curve.

The volatility is mild on the 4-hour chart, with the upper band of the Bollinger bands indicator present at the $52.47 mark, and the price is traveling towards the upper band, whereas the lower band is present at the $51.33 mark. The RSI graph shows horizontal movement as the indicator is trading at index 41.33, hinting at selling pressure building up at the current price level.
Litecoin price analysis conclusion
The one-day and four-hour Litecoin price analysis predicts a tremendous rise in coin value for the day, as the bulls have been dominating the price charts. Green candlesticks are marking a strong bullish trend as the cryptocurrency value climbed to a $52.47 high.
Disclaimer. The information provided is not trading advice. Cryptopolitan.com holds no liability for any investments made based on the information provided on this page. We strongly recommend independent research and/or consultation with a qualified professional before making any investment decisions.


