Litecoin price analysis shows the presence of a bullish trend in the market. The cryptocurrency has witnessed a slight price increase of 4.77% over the past 24 hours and is currently trading at $65.20. The support for LTC/USD is present at $61.86, and a break below this level may result in a price decline to $61.50 support. On the other hand, the resistance for the pair is at $65.77, and a breakout above this level could take it to $66.00. which is the next major resistance.
Litecoin price analysis 4-hour chart: Bulls stumble to keep control
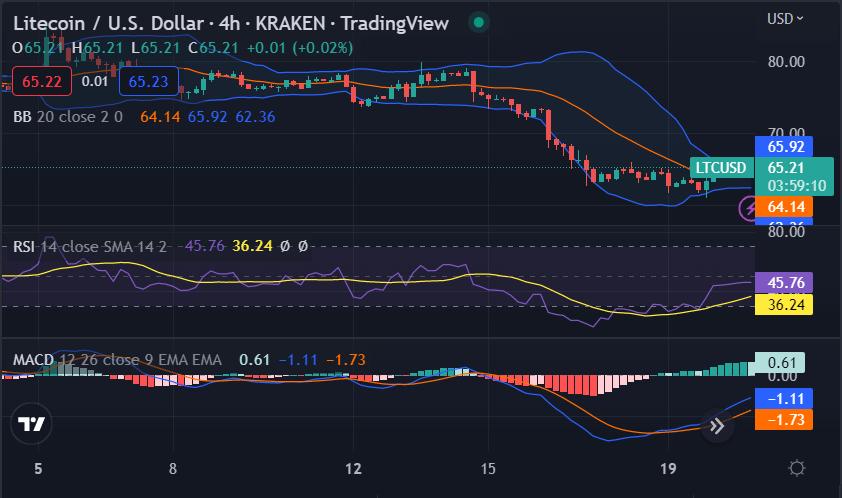
The hourly Litecoin price analysis chart reveals that the cryptocurrency has been following an uptrend for the last few hours. On the other hand, the price has seen a slight downtrend over the previous few days as the market corrects itself after a strong rally. The market has formed higher highs and higher lows which is a bullish sign.

The volatility is increasing on the 4-hour chart, as the MACD reveals increasing bullish momentum in the market as the signal line crosses above the histogram. The RSI indicator is also moving in the overbought region, which indicates that LTC/USD may see a slight correction before it can resume its upward trend. The upper Bollinger band is at $65.92, while the lower band is at $62.36.
LTC/USD 1-day price chart: Price moving unboundedly upwards
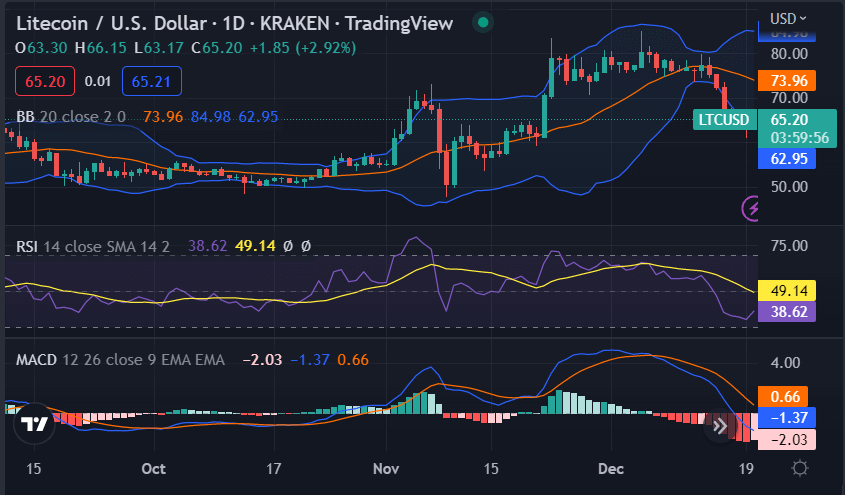
The 1-day Litecoin price analysis chart shows that the cryptocurrency is currently trading in an ascending channel. The digital asset has seen a strong rally over the last few days as it surged from $61.86 to its current price level. However, the market may see a correction in the near future as the RSI indicator is currently in the overbought region.

The 1-day MACD for LTC/USD is currently above the signal line, which indicates a slight bullish momentum in the market. The Relative Strength Index is currently at 49.14, and a break below this level could signal a price correction. The Bollinger bands are currently showing minor volatility in the market as the upper band is at $84.98, while the lower band is at $62.95 on the 1-day chart.
Litecoin price analysis conclusion
The one-day and four hours Litecoin price analysis is indicating a bullish trend for the day as the price is on its way to recovery once again. The LTC/USD value is now standing at $65.20 and it can be expected that further upside is coming ahead. However, the resistance at the $65.50 level might cause some major resistance. If the buyers fail to push past this barrier, we might see a dip in the price.


