The Litecoin price analysis confirms that bearish pressure is dominating the market after a bearish engulfing pattern- a candlestick chart formation of the previous day. The LTC/USD pair has slipped below $80:00 and is currently trading at around $79.46.
The bullishness that was seen in the last session has been entirely erased as the bears take control of the market. The support for LTC/USD is currently present at $75.65, and if it continues to fall, this level could be tested soon. On the upside, there is a strong resistance present at $80.91, and if Litecoin manages to break above this level, it could gain some momentum and surge higher.
Litecoin price analysis 1-day price chart: Bearish pressure takes LTC below the $80.00 level
The daily chart for Litecoin price analysis shows a downward-sloping trendline. The bearish trend has again damaged the cryptocurrency’s value to a good extent as it plummets from the intraday high of $80.91 to the current level of $79.46. The LTC/USD pair has lost nearly 1.13%, but the coin has still managed to remain below the $80.00 level, which was breached earlier.

The volatility is still low as the bears keep dominating the market. The Bolinger bands of the pair are also contracting, which indicates that there is not much happening on the market. The upper Bollinger band is at $88.23, and the lower band is placed at $76.23. The Relative Strength Index (RSI) is also seen at 42.25, which confirms that the bears have an advantage over the bulls as of now. The moving average indicator on the 1-day chart shows that the 50-day MA is placed below the 200-day MA, which reinforces a bearish sentiment in the market.
Litecoin price analysis 4-hour price chart: LTC extends downside move
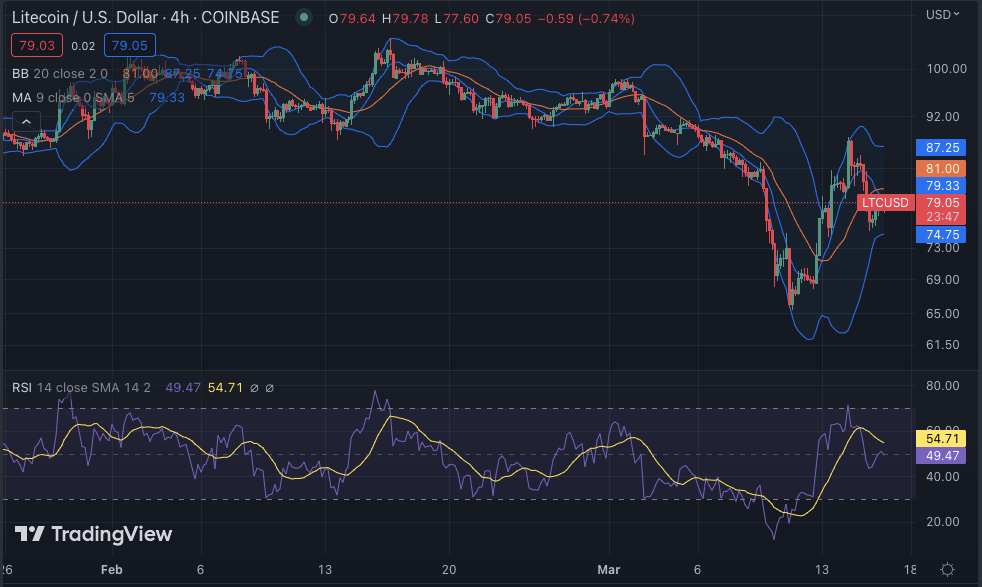
The 4-hour chart for Litecoin price analysis reveals that a descending pattern is dominating the market. The LTC/USD pair has extended its downside move and is now trading slightly at $79.43. The LTC/USD has been trading in a range between $75.65 and $80.91 for the past 24 hours, and both these levels could act as strong support and resistance, respectively.

The moving average value is at $79.3, which indicates that the bulls are attempting to take control of the market. The RSI is also at 50.40 and has entered into the neutral zone, which could push Litecoin further down if it does not gain enough buying pressure soon. The upper Bollinger band and lower Bollinger bands are at $87.25 and $74.75, which confirms that the price is stuck in a tight range and could break out either way soon.
Litecoin price analysis conclusion
Overall, the Litecoin price analysis shows that bearish pressure dominates the market as of now, but there could be a chance of bullishness if the coin manages to find strong support at $75.65. However, the bulls will have to break above $80.91 in order to gain some momentum and surge higher. The bears are trying to take control of the market, and if they succeed, then Litecoin could continue its downside move.


