The latest Litecoin price analysis shows a bearish trend despite its efforts to surpass the $92.8 resistance. In the past few hours, the price has faced rejection at this level, resulting in a continuous downward drift. Sellers’ pressure has pushed the price down to $92.1, with red candlesticks dominating the current graph.
Litecoin price: Daily chart gives bearish signals for the market
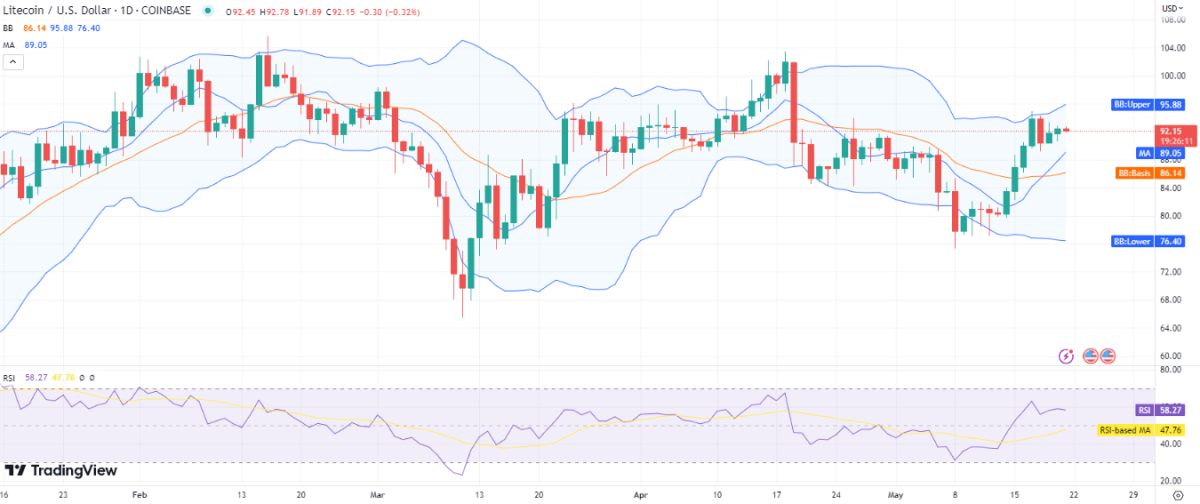
Based on the 1-day price chart for Litecoin price analysis, it becomes apparent that bulls and bears have engaged in intense competition over the past couple of days. The coin experienced a robust bullish trend, reaching its highest point at $93.8 on May 17, 2023, accompanied by substantial value growth. However, maintaining the $93 level has posed challenges, resulting in the current price decline to $92.15. The return of selling pressure today has further contributed to the downward movement.

A comprehensive assessment of the Bollinger bands reveals an average value of $86.1. The upper boundary of the bands indicates a resistance level of $95.1, while the lower boundary represents a support level of $76.4. Additionally, the moving average indicator (MA) still aligns with the previously bullish sentiment, displaying a value of $89 in the analysis.
With an RSI score of 58, the indicator resides in the upper portion of the neutral zone, suggesting a state of equilibrium. The flat curve further suggests competition between buyers and sellers in the market.
Litecoin price analysis: Recent developments and further technical indications
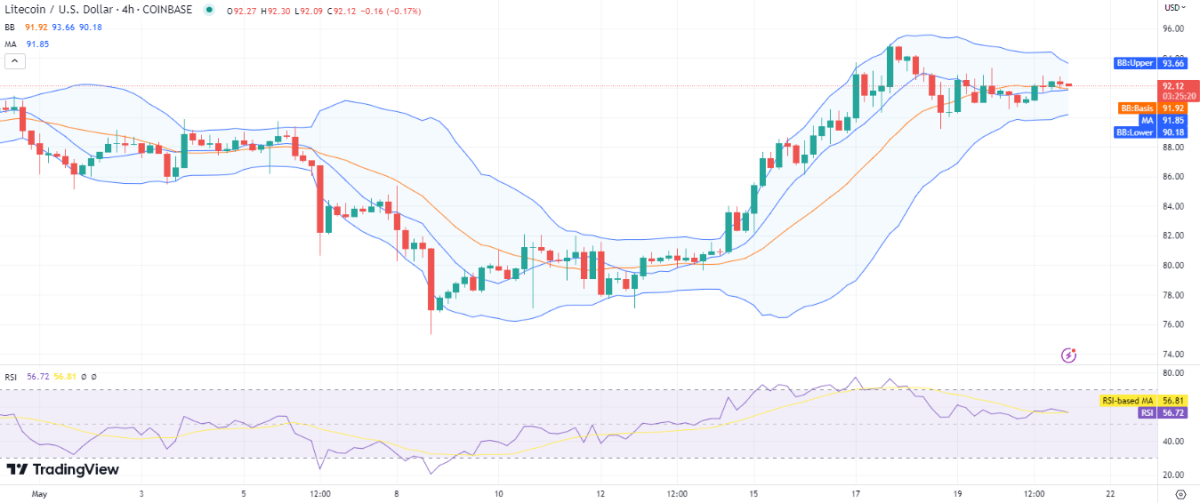
Today’s hourly Litecoin price analysis reveals disappointing outcomes for prospective buyers. The prevailing trend has predominantly favored the bears, resulting in a gradual decline in price since the commencement of the trading session. However, it is important to note that the downtrend remains manageable, and no significant setbacks have been encountered thus far.

The Bollinger Bands indicator exhibits a gradual contraction, indicating a decrease in overall volatility for the cryptocurrency. This reduction in volatility suggests a high chance of fewer price oscillations during today’s trading session. On the four-hour chart, the average value of the Bollinger bands is recorded at $91.9. The upper band is positioned at $93.6, while the lower band has moved to $90.1.
Looking at the moving average indicator’s statistics, it is positioned below the SMA 50 curve at the $91.8 level. On the 4-hour chart, the RSI value stands at 56, representing an average figure. However, the downward slope of the RSI curve indicates the progress made by sellers in the market.
Litecoin price analysis conclusion
Based on today’s Litecoin price analysis, a bearish movement can be anticipated. Taking a closer look at the one-day LTC/USD chart, a distinct resistance level of $93.8 is observed. Volatility, as depicted on the charts, is higher on a daily basis, but it is gradually decreasing on an hourly basis, making it challenging to predict precise future trends. However, should LTC/USD successfully hold its current support level, there is a fair chance of recovery following a later correction.


