Litecoin price analysis is indicating a bullish price movement for today after the market retraced back to $61.75 from a low of $58.79 yesterday. LTC/USD is currently facing resistance at the $64.29 level, but if this level is broken, it could lead to further upward momentum for LTC prices. Support for LTC/USD can be found at the $58.79 level.
The Litecoin price is currently trading in a bullish trend as the bulls push the price higher. The 24-hour trading volume for LTC has increased, showing more market participation in the coin as it is currently sitting at $1.47 billion. Litecoin’s market cap currently sits at $4.42 billion, making it the sixth-largest cryptocurrency by market cap.
LTC/USD 1-day price chart: Bulls lead the price to $61.75 gaining more than one percent value
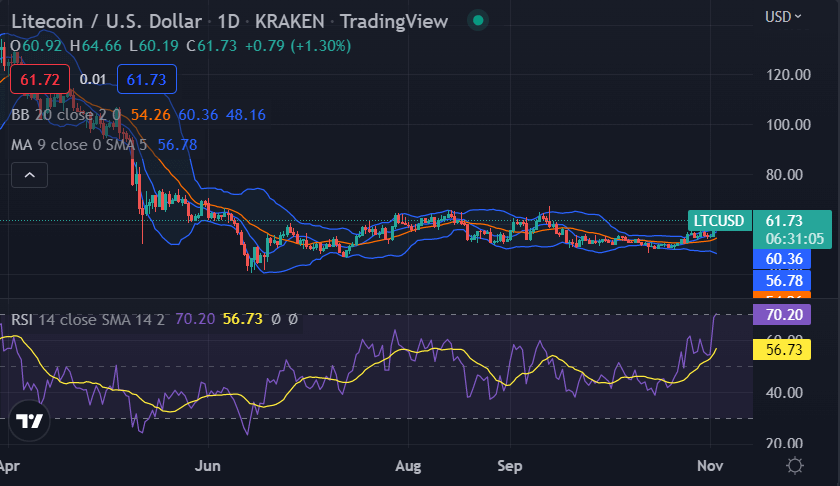
The one-day Litecoin price analysis observed a rise in price because of the ongoing bullish wave. Cryptocurrency overcame the sudden pressure from the bears, and the price levels have improved to $61.75 today gaining more than one percent value during the last 24 hours. It is expected they will achieve a new high above the first resistance level present at $64.29 if the bullish momentum continues. The coin also reports a massive gain of 11.63 percent in value over the past week, which shows the bullish dominancy.

The moving average (MA) on a daily time frame also reports a bullish trend for the coin as it is currently at the $56.78 level. Technical indicators such as the Relative Strength Index (RSI) also show an upward trend for the coin on a daily time frame as it currently stands above the 50 levels at 56.73, which suggests buying pressure in the market. The Bollinger bands are expanding and the upper band has reached the price level of $64.29 representing the resistance, while the lower one simultaneously reached $58.79 representing the support for the LTC price.
Litecoin price analysis: Recent developments and further technical indications
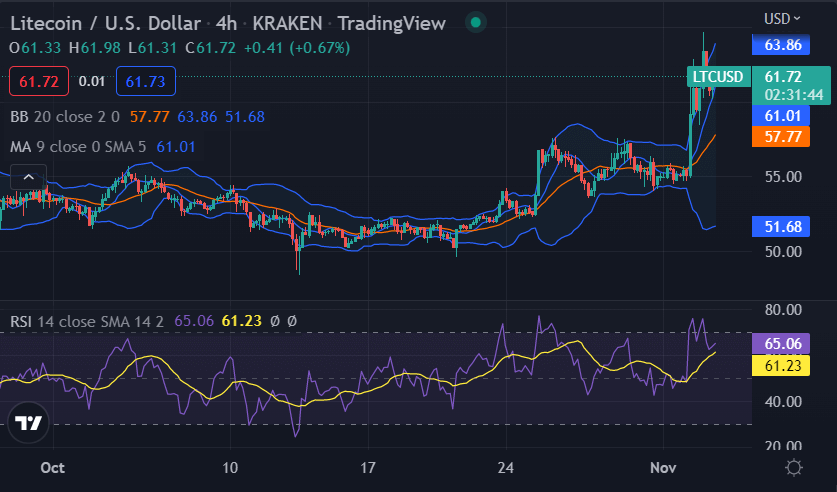
The 4-hour Litecoin price analysis shows a progression of green candlesticks which shows a continuous rise in price levels for the last 4 hours. Previously there has been a constant bearish wave dominating the price action, today, the trend is in favor of buyers. The Bollinger band average is showing a $57.77 value, with mild volatility.

The upper limit of the Bollinger bands has gone up to $63.86 and the lower one is settling at $0.134. The moving average, on the other hand, is showing us the collective standard of $61.01 in the 4-hour candlestick chart. the RSI score has increased up to index 61.23 due to the ongoing bullish trend.
Litecoin price analysis conclusion
To sum up the Litecoin price analysis, LTC/USD is currently experiencing a bullish recovery as the price retraces back to $61.75. The confirmed one-day and four-hour time frames all show a bullish trend for LTC, break above the $64.29 level could lead to further bullish momentum for LTC prices.
Disclaimer. The information provided is not trading advice. Cryptopolitan.com holds no liability for any investments made based on the information provided on this page. We strongly recommend independent research and/or consultation with a qualified professional before making any investment decisions.


