The Neo price analysis is bearish for today. Bears have brought down the price to $8.70, canceling out yesterday’s gain in value. Traders are entering the market to sell their NEO/USD assets, fearing another price drop. Bears flourished during the last few hours as selling pressure increased in the market, and the bullish trend came to a halt. Though the last week proved good for the coin, bears successfully took over and reversed the price function, and indications are there for a further decrease in price.
Resistance for Neo price analysis is set at $8.93, and support is found at $8.40, either of which can be broken depending on the market movements. The 24-hour trading volume for NEO/USD has decreased to $33 million, showing a decrease in trading activity, and a market cap of $613 million.
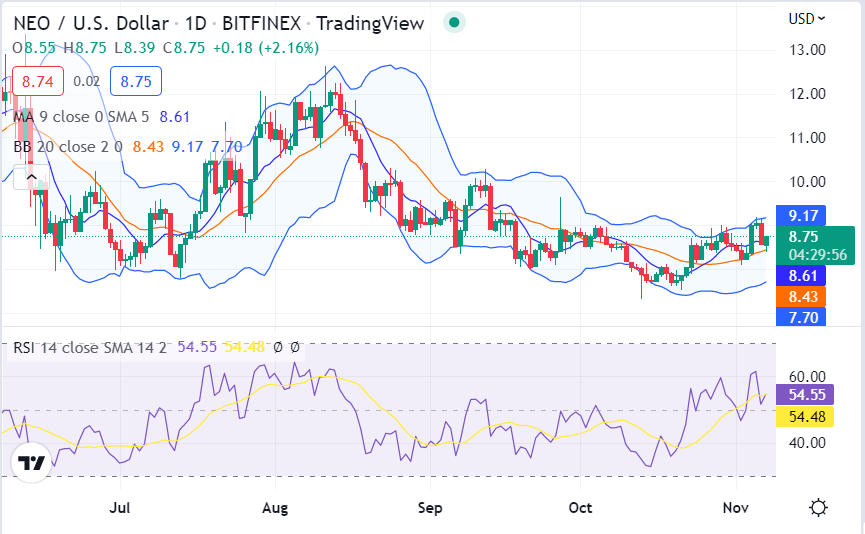
NEO/USD 1-day price chart: Traders fear a short-term price drop
The 1-day price chart for Neo price analysis shows bears are pulling the price down and seem successful in their attempts. Price is decreasing gradually as bears continue their lead. The past few hours proved insignificant for the cryptocurrency. The NEO/USD pair traded between the range of $8.40-$8.90 today and is trading hands at $8.70 at the time of writing.

The MACD indicator is reddish in color, presenting a bearish trend, but the histograms’ light red color shows not a very intense bearish trend but a clear indication of active selling activity happening at the time. The volatility for NEO is comparatively high, and the Bollinger bands movement shows both ends on a downslope with their average line above the price level, which shows the price might go down in the coming time. The Relative strength index (RSI) is in the bearish zone, below the 54.48 level, and has moved closer to the oversold region.
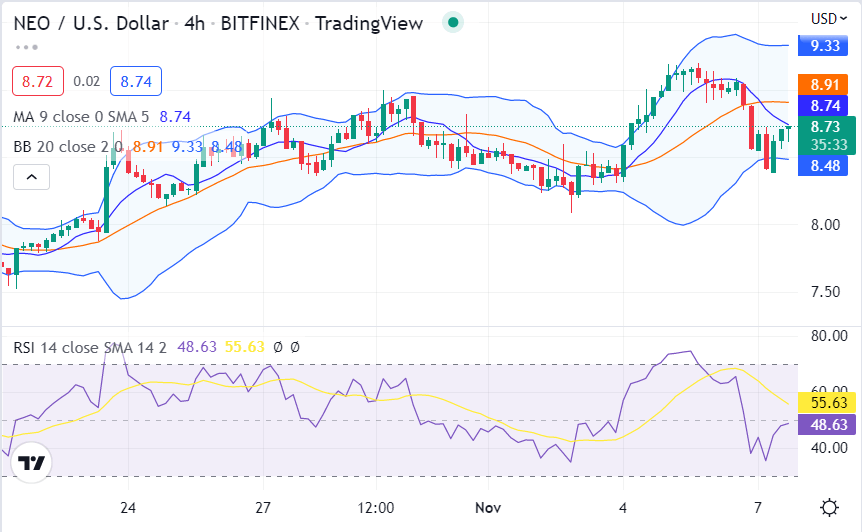
Neo price analysis 4-hour chart: NEO shows a price drop and technical indications
The 4-hour price chart for Neo price analysis shows price is dropping every hour, but not at a huge rate. There are chances of a sharp price drop as well in the coming hours. The bulls are trying to reclaim control, but bears seem to be stronger at the moment.

The volatility is mild but continues on the 4-hour chart with the upper Bollinger band at $9.33, and the lower band at $8.48, the mean average of Bollinger bands is forming at $8.68. The MACD indicator line is below the signal line and is bearish in color, indicating a bearish trend. The RSI indicator is at 55 levels, representing neutral territory but leaning towards bears dominating.
Neo price analysis conclusion
The daily basis and hourly Neo price analysis and technical indications suggest a bearish momentum is on the go, so a drop in price is expected, the Neo price analysis shows that the coin is correcting today and may continue to follow a downtrend for today as the bears look to push the prices below the $8.70 mark.
Disclaimer. The information provided is not trading advice. Cryptopolitan.com holds no liability for any investments made based on the information provided on this page. We strongly recommend independent research and/or consultation with a qualified professional before making any investment decisions.


