Polkadot price analysis shows that the DOT/USD pair is facing a bearish market as it has slipped below the $6.00 mark. The key support level for the pair is present at $6.02, and if this level breaks, the pair may drop to the $5.90 support level. On the other hand, the resistance level is at $6.16, and if the bulls can push the price above this level, the pair may rise to the $6.30 resistance level.
Polkadot appeared to be in a bullish market as it was trading above the $6.30 mark. However, it seems that the bears have gotten the upper hand as the price has fallen below the $6.00 mark. However, since then, the token has been on a downward trend and has lost over 1.35% of its value. At the time of writing, DOT/USD is trading at $6.02 and is facing a bearish market. The digital assets market has been facing a lot of volatility in the past few days, and DOT is no exception.
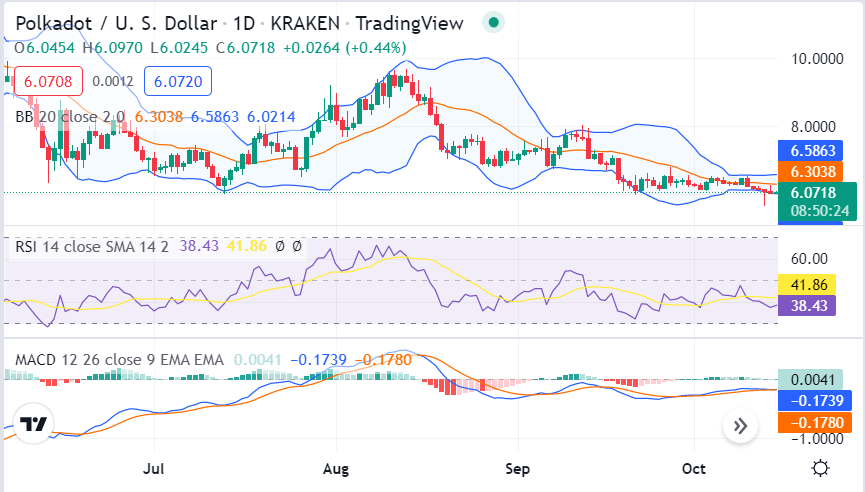
Polkadot price analysis on a daily chart: Bears adamant in pushing DOT below $6.08
On the 1-day Polkadot price analysis chart, we can see that DOT has formed a descending triangle pattern. This is a bearish pattern and indicates that the bears are in control of the market. The price has been struggling to break out of the $6.16 resistance level for the past few hours, and as a result, the token has begun to fall. The 24-hour volume market for the pair is $147,823,844 while the market cap is at $6,847,057,846.

The Relative Strength Index for the pair is at 41.86and is in the oversold region, indicating that the token may see some buying pressure soon. The Moving Average Convergence Divergence indicator is in the bearish zone and is indicative of a continued downtrend. The Bollinger band indicator shows that the price is near the lower Bollinger band, which is a bearish signal.
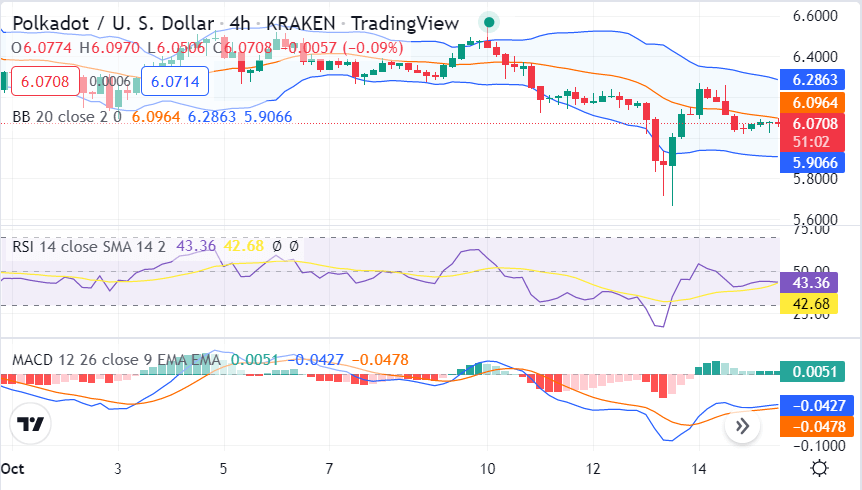
DOT/USD 4-hour price analysis: Latest developments
The 4-hour Polkadot price analysis chart indicates that the price is currently trading below the $6.16 level and may fall to as low as $5.90 levels if the $6.02 support level is broken. Bulls tried to push the price above the $6.16 resistance level, but they were unsuccessful. The upper Bollinger band is currently at $6.16, while the lower Bollinger band is at the $6.02 mark.

The Relative Strength Index for the pair is currently at 42.68 and is in the neutral region, indicating that the market may see some sideways action in the near future. The MACD indicator is currently in the bearish zone, and the signal line is below the histogram, which is indicative of a continued downtrend.
Polkadot price analysis conclusion
Polkadot price analysis reveals that the cryptocurrency is currently in a bearish market the coin price covering ranges downwards and is trading at the $6.08 mark. Chances are there for further decrease as the price has decreased during the last hours. We expect the DOT/USD to float above the $6.02 support level and may rebound to $6.16 in the near term. The technical indicators are currently bearish, and a breakout or a rebound is awaited before making any investment decisions.
Disclaimer. The information provided is not trading advice. Cryptopolitan.com holds no liability for any investments made based on the information provided on this page. We strongly recommend independent research and/or consultation with a qualified professional before making any investment decisions.


