Polkadot price analysis for today is in favor of the bears as the prices continue to bleed downwards. DOT is facing resistance at the $4.53 mark while the key support is seen at $4.46. The overall trend remains bearish and further losses cannot be ruled out in the near future. Polkadot prices are exchanging hands at $4.46 at the time of writing, a decline of 1.29 percent.
Polkadot prices have been on a downward spiral for the past few hours, with the coin seeing a substantial decline of almost 4.72 percent over the past seven days. The overall market sentiment has been bearish with most of the top coins recording losses. DOT is not an exception and is currently trading at its lowest level in over a today.
Polkadot price action in the last 24 hours: DOT touches $4.46 lows as bears rule the charts
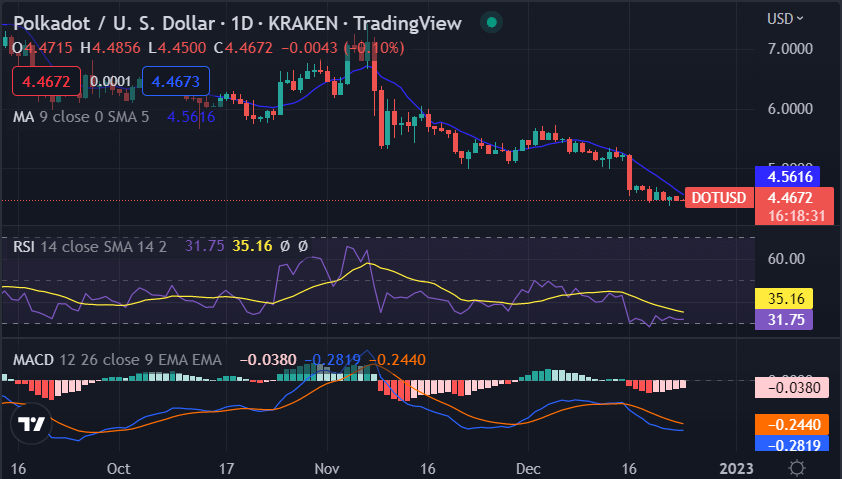
Polkadot price analysis has been on a downward spiral in the last 24 hours and is currently trading between a range of $4.46 to $4.53 with a trading volume of $94,847,665 and a market capitalization of $5,129,403,233. The downtrend is expected to continue soon as the bears maintain control over the market sentiment as per Polkadot price analysis. The prices are likely to dip further down as the selling pressure intensifies in the coming days.

The technical indicators are in favor of the bears and suggest that the prices could dip lower in the near future. The RSI is currently at 35.16 and is showing no signs of a reversal. The MACD indicator is also in bearish territory and indicates that the selling momentum is still strong. The moving average indicator is also bearish and suggests that the downward trend could continue in the near future.
Polkadot price analysis on a 4-hour price chart: Recent developments
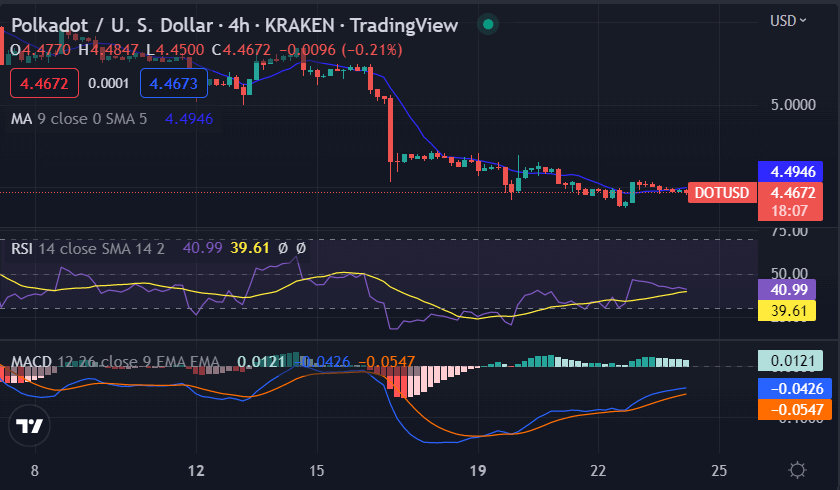
The 4-hour Polkadot price analysis is bearish as the prices continue to remain under pressure. The key support for the coin is seen at $4.46 while the resistance is present at $4.53, Either of the levels could be breached in the coming hours. However, currently, the trend remains bearish and further losses cannot be ruled out in the near future.

The MACD is still bearish and indicates that the selling pressure could continue in the coming hours. The RSI is currently at 39.61, which further confirms the bearishness in the market. The moving average is currently bearish at $4.49 and is expected to remain so for the next few hours.
Polkadot price analysis conclusion
Polkadot price analysis for today is bearish as the prices continue to bleed downwards. The overall trend remains bearish and further losses cannot be ruled out in the near future. Bulls are expected to defend the key support level at $4.46 in order to avoid a further decline.


