Polkadot price analysis shows a decrease in price over the past 24 hours as the bears are seeking to push the token back below $6.00 as it had previously been trading there until its recent pullback. The bears are now making an aggressive move to push the asset back down, with the price currently sitting at $5.90.
The resistance for the DOT/USD pair is seen at $5.97 and a break past this level will lead to more upside in the short term. On the other hand, if bears manage to overcome this resistance point and move below it, we could see the price going even further down. The support level for DOT is present at $5.85 and a break below this level will lead to more downside in the short term.
DOT is currently trading at the 11th position in terms of market capitalization with a total value of around $7.01 billion, according to CoinMarketCap. Both the market cap and the trading volume are on the decrease, indicating that the bears are in full control of the market.
Polkadot price analysis 1-day chart: DOT faces resistance at $5.97 as bearish persists
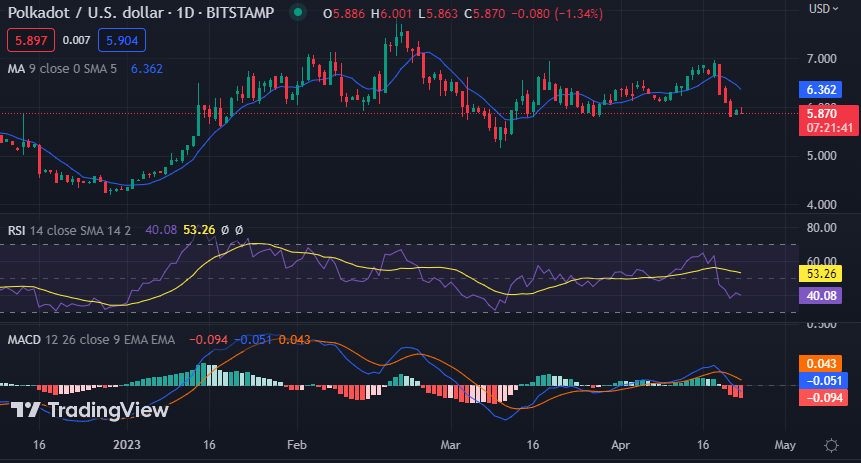
The daily chart of Polkadot price analysis shows a bearish move in price as the bears push ADA lower. DOT opened today’s trading session above the $5.90 mark before the bears pushed the token down to $5.85 during the early hours of trading. Since then, however, the bears have been taking control and pushing the price back down whereby DOT has seen a decrease of 0.91 percent.

On the technical indicators, the Relative Strength Index (RSI) is currently at 40.08 and still in a neutral zone which means that there is no clear indication of a bullish or bearish trend yet. The MACD indicator for DOT/USD pair is trending downwards with the histogram in the negative territory indicating the presence of bearish pressure on the asset. The moving average (MA) indicator shows a value of 6.36 which is above the DOT’s price confirming the bearish trend.
Polkadot price analysis hourly chart: Bearish momentum holds for DOT/USD pair
The hourly chart of Polkadot price analysis shows that the bears are in complete control as they hold a strong grip on the market. The most recent candle closed with a bearish engulfing pattern, indicating that the sellers are becoming more extreme in their selling behavior.

The RSI indicator is also at 32.93 and trending lower which shows that the bearish momentum is still intact and if bears manage to break the $5.80 level, we could see some further downside ahead for DOT. The MACD histogram shows a decrease in momentum as the green bars are fading away supporting the bearish pressure present on the asset. The MACD line is still above the signal line as the buyers are trying to make a comeback. The moving average (MA) indicator has red candlesticks in the chart thus confirming the price decline.
Polkadot price analysis conclusion
In conclusion, Polkadot price analysis shows that the bears are still in full control of the market as they continue to push DOT lower. The immediate support level at $5.85 is very important for the bulls and if they manage to bounce back from this level, we could see a recovery in price. On the other hand, if bears break below the support of $5.85, more downside might be seen ahead.


