Polkadot price analysis is showing signs of an uptrend as the bulls have been leading the game for the past few days. The price of DOT rose to a high of $6.47 on the back of a strong bullish swing. The bulls have been increasing their presence in the short term, pushing the price higher as they break through resistance levels one after another. At press time, the digital asset has been trading in the range between $6.27 and $6.47 for the past few hours.
Furthermore, the 24-hour trading volume of DOT has spiked significantly to $198 million which shows growing demand for the asset. The market capitalization of the digital asset has also surged to $7.6 billion, which is higher than the level just a few days ago.
Polkadot price analysis 1-day chart: Bullish impulse results in DOT climbing above $6.47
The one-day Polkadot price analysis is showing relatively positive results for the cryptocurrency today. The chart reveals a strong bullish impulse that has pushed the price up to $6.47 in a matter of hours, with a surge of about 3.08 percent. The DOT/USD price has improved to a great extent with the help of constant support from the buyers’ side. The cryptocurrency has been following an upward trend quite consistently and even today a rise in price has been reported.
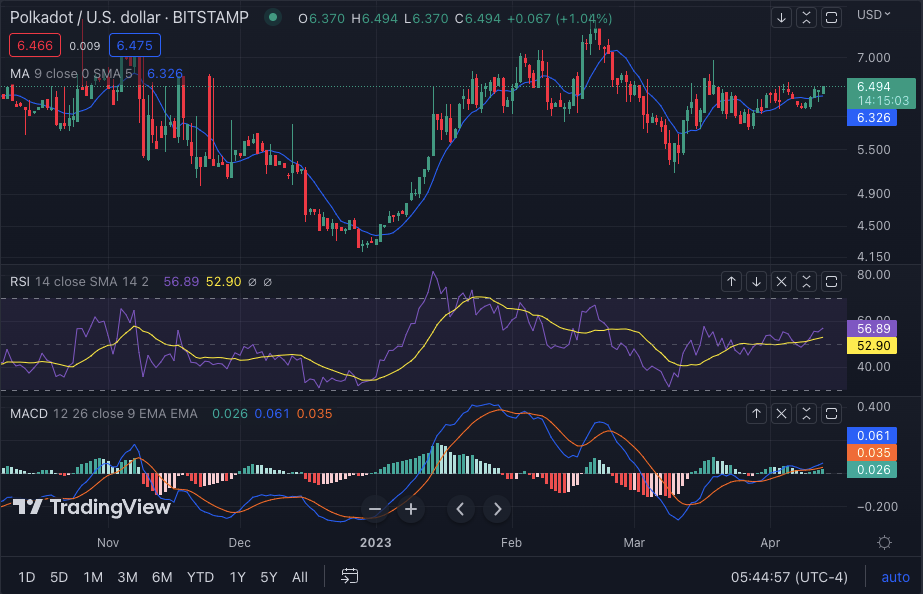
The MACD indicator is in green color and the lines in that indicator are also pointing upwards. This is evidence of the bullish momentum which is present in the market right now. The RSI indicator is well above the 50 mark, which further confirms that the bulls are in control of this digital asset. The moving average indicators are also indicating a bullish trend, which could be beneficial for DOT holders in the long run.
Polkadot price analysis 4-hour chart: Bullish price action results in strong gains
The four-hour Polkadot price analysis shows a clear bullish trend. The bulls have been dominating the market since Monday and pushed the DOT/USD pair to a high of $6.47 today. At press time, the buyers are trying to break through the level of $6.50, which could lead to further gains for the digital asset, if bullish momentum continues.

The Moving average convergence/divergence (MACD) indicator is on the bullish side, with both the lines in the indicator pointing upwards. The Relative Strength Index (RSI) is also well above the 50 mark which shows that the bulls are firmly in control of this digital asset. In addition to that, the Parabolic SAR indicator is also giving a bullish signal for DOT/USD. The moving average is currently at the $6.36 level and is giving a positive signal for price action in the near future.
Polkadot price analysis conclusion
In conclusion, Polkadot price analysis shows that the bulls are in control of this digital asset at the moment and it could lead to further gains for DOT holders if they manage to break through the level at $6.50, which could open the door for further growth in the near future. The technical indicators are all in the green zone and also give a positive signal for price action.