Polkadot price analysis shows hows a bearish outlook for cryptocurrency today after the DOT/USD pair dropped to $6.79 after hitting a high of $7.02 earlier in the week. The pair has been in a downward trend since the start of today and this week it dropped to its lowest level. The market sentiment has been bearish for Polkadot ever since the DOT/USD pair dropped below $6.80 and it is currently trading at a support level of $6.69.If the pair breaks below this support level, it could fall even further and test its next support level which lies at $6.60.
The selling pressure has further pushed the price below $6.83, which is now the resistance level and it will be difficult for the bulls to retake control of the market at this point. The market capitalization of Polkadot is currently hovering around the $7.99 billion mark, with a loss of 0.51% over the last 24 hours. The total trading volume for the cryptocurrency is now at $161 million for the last 24 hours.
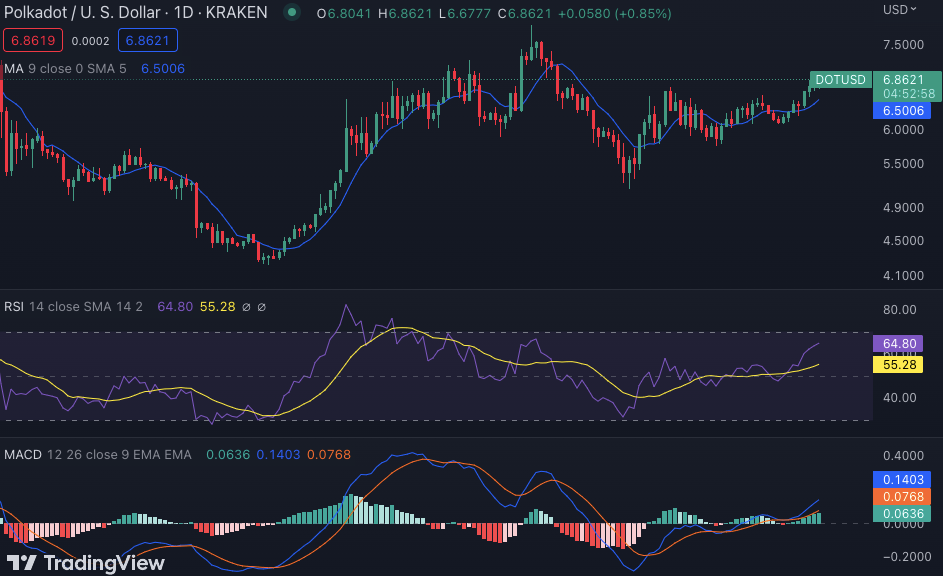
Polkadot price analysis 1-day chart: DOT is facing rejection at $6.83 after a bearish pressure
The 1-day Polkadot price analysis shows that the bearish sentiment is likely to continue in the near term as the DOT/USD pair is trading below $6.79 and could further test its support levels. The digital asset has lost nearly 0.53% of its value in the last 24 hours, and it remains to be seen if the bulls can turn things around. The price levels have also continued to decline in recent hours as bears seize every opportunity.

The 50-day and 200-day moving averages have crossed each other, which is another bearish signal for the coin. The Relative Strength Index (RSI) on the 24-hour chart is currently at 64.80 and has entered the overbought zone, indicating that further selling pressure may soon appear in the market. The MACD on the daily chart is in the bearish zone, with red bars appearing on the histogram. The signal line(red) is below the MACD line (blue), which suggests that selling pressure is likely to continue.
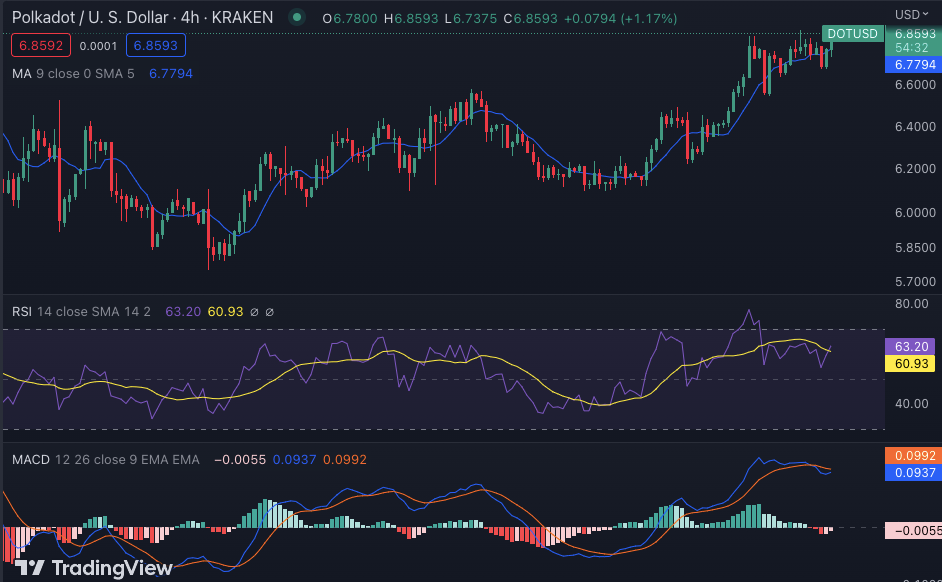
DOT/USD 4-hour price chart: Recent developments and further technical indications
The 4-hour price chart for Polkadot paints a very bearish picture as the price has been in free fall since the beginning of today, and is currently trading well below $6.79. The market decline has been caused primarily by the lack of buying support and an increase in selling pressure. If the price drops below $6.69, it could test its next support level of $6.54.

The technical indicators are also showing a bearish outlook for Polkadot as the MACD line is below the signal line, indicating that the bears are in control of the market. The relative strength index (RSI) is also bearish as it has dropped to 63.20 and could fall even further. The next few days could be crucial for Polkadot as the price has reached a critical support level and any further decline could push it toward its next support and resistance levels. The moving average indicator value is at $6.7794, which shows that the bears have a strong presence in the market and are likely to push prices lower.
Polkadot price analysis conclusion
To conclude, Polkadot price analysis suggests that the bears are in control of the market and the digital asset could test its next support level if it breaks below $6.69. The technical indicators also show a bearish sentiment and investors should be cautious before making any investments.


