
The Polkadot price analysis shows that the bears have taken control of the market as DOT slipped to $6.15. The selling pressure of the bears has been dominating the markets, causing the DOT to remain in a bearish trend. Polkadot opened its trading session at $6.14, and buyers pushed the price to a high of $6.28. However, the bulls could not hold on any longer, and they soon started to lose control as the bears took over.
The resistance for DOT/USD is present at $6.28, and if it fails to break above this level, then the price action could continue lower toward the immediate significant support level at $6.12. A slip below the $6.12 support level could cause further losses for Polkadot, as it could slide below the key resistance level of $6.00. DOT is currently trading at $6.15 and has seen a loss of 0.55% in the past 24 hours.
Polkadot price analysis 24-hour chart: DOT devalues at $6.15 as bears strike
The Polakdot price analysis 24-hour chart shows that the DOT/USD pair has been trading in a downtrend for most of today’s session. The bulls had a short-lived rally earlier in the day when they pushed the price to the $6.28 resistance level briefly before being overcome by selling pressure. DOT market capitalization, on the other hand, is also decreasing and currently stands at $7.20 billion.
In terms of technical indicators, the MACD line is trending below the signal line in the bearish territory, indicating a bearish momentum has a major influence on the market. The RSI indicator has reversed and is heading toward the neutral zone, suggesting that the selling pressure is decreasing and there might be a chance of bulls making a comeback.

The moving average (MA) shows that the long-term and short-term MAs are now trending below the price action. Both MAs indicate a bearish sentiment as they move lower toward the price level, suggesting more losses in DOT’s near future.
Polkadot price analysis 4-hour chart: Recent developments and further indications
The 4-hour Polkadot price chart confirms that a downtrend has been taking place for the past few hours. The DOT/USD pair is trading in a range of $6.13 and $6.19, and the price is currently hovering near the bottom of the range at $6.15 as bears are currently in control of the market but the bulls are trying to make a comeback.
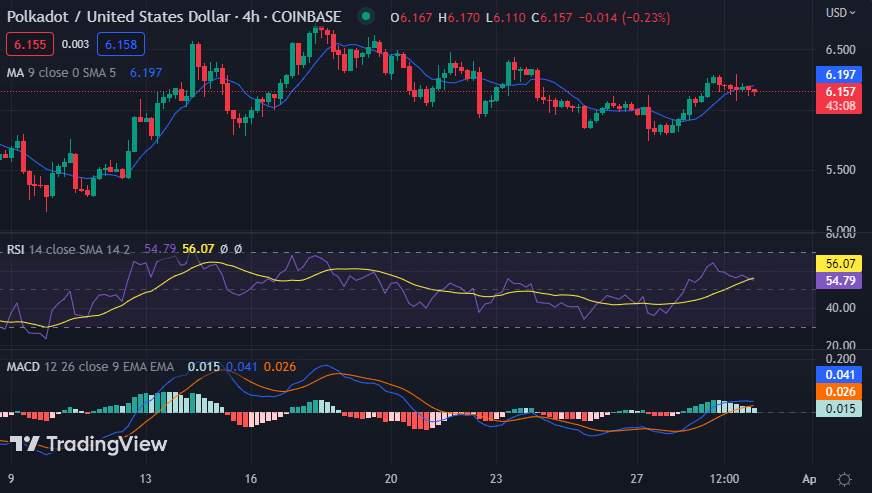
The hourly technical indicators for DOT/USD have turned bearish, as the RSI indicator’s current level is at 54.79 heading south, indicating a bearish run in the near term. The moving average is trending downwards, showing that bearish sentiment has been dominating the market lately. Additionally, the MACD histogram is in a downtrend as the green bars are diminishing, suggesting that selling pressure has been driving down the price.
Polkadot price analysis conclusion
The Polkadot price analysis shows that the coin is currently in a bearish state with the price trading at $6.15, and the bears are in control of the market. The resistance level is seen at $6.28 while support has been established at $6.12, which could further influence DOT’s current trend if violated.


