Polkadot price analysis shows a bullish trend, as an increase has been recorded in the last 24 hours. The DOT/USD pair is currently trading at $6.21, up 0.77% in the past day and up 2.55% in the last seven days. The price of Polkadot is currently trading above the $6.13 support level, indicating that bulls are in control of the market. The market has been following bullish momentum in the past few days and is expected to continue its uptrend.
The bulls are demonstrating strength and are pushing the price higher. The resistance level of $6.23 has been broken, which is a bullish sign, and a further increase is expected in the near future. If the bulls are able to break the next resistance level of $6.27, it could be tested in the upcoming session. The support level is strong at $6.13, and any dip below this level will be met with buying pressure.
Polkadot price analysis 1-day chart: DOT spikes high as bullish momentum builds strongly
The 1-day Polkadot price analysis shows the coin has had a steady uptrend and reached an intraday high of $6.21 during the past 24 hours. The 24-hour trading volume is still decreasing as the buyers are taking a cautious approach; it is now at $138 million. The total market capitalization stands at $7.288 billion, an increase of 0.78 percent; it is currently the 11th largest cryptocurrency in the world.
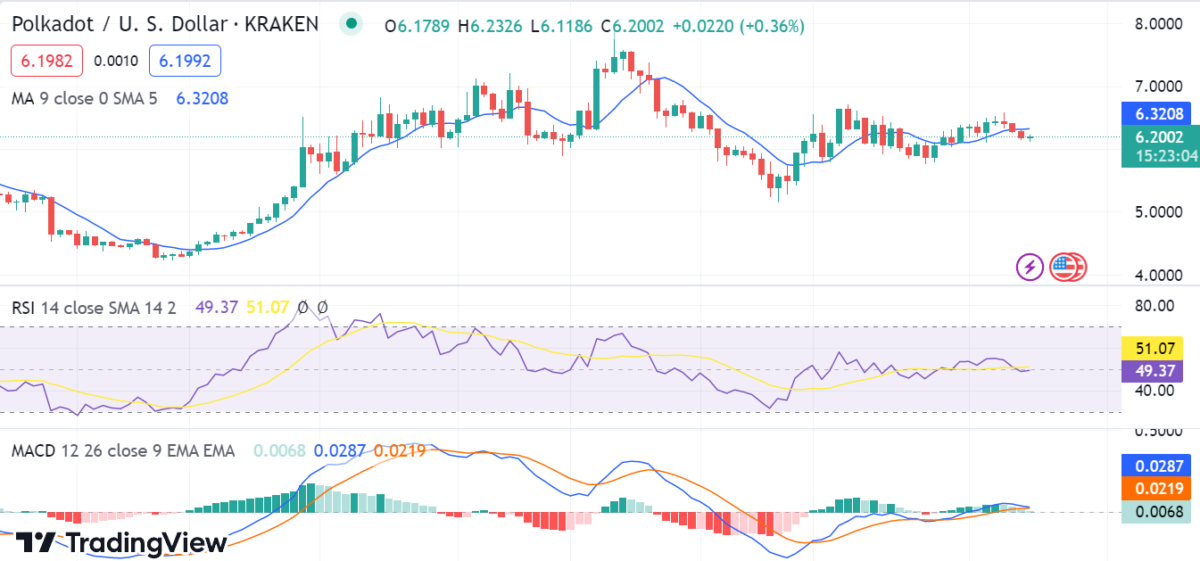
The bullish momentum seems to be slowing down as bearish histograms appear on the MACD indicator. The MACD line is crossing above the signal line, indicating that bulls are slowly gaining control of market sentiment. The RSI is currently at 49.37 and indicates a sideways movement in the near future. The moving average is in a bullish crossover. The MA is currently at $6.3208 on the daily price chart and shows that the bulls are in full control of the market.
DOT/USD 4-hour price chart: Recent updates
The hourly Polkadot price analysis shows that the coin has had a steady uptrend in the last 24 hours and is currently trading above the $6.21 level. The buyers have been in control of the market sentiment and are pushing the price higher. The next resistance level to be tested is $6.27, which, if broken, could lead to a further increase.

The hourly technical indicators also show a bullish signal as the MACD is crossing above the signal line, indicating that bulls are slowly gaining control of the market sentiment. The relative strength index (RSI) is slightly declining, which indicates oversold territory as it is currently at 41.57. The MA is currently at $6.1887 and is showing that the bulls are in full control of market sentiment.
Polkadot price analysis conclusion
Overall, Polkadot’s price analysis has had an impressive run in recent weeks and appears to be headed upward in the near term. The DOT prices have slightly pulled back, but the coin is still trading above $6.21, with an increase of 0.77% in the past 24 hours. The technical indicators are also showing a positive trend that supports the prediction.