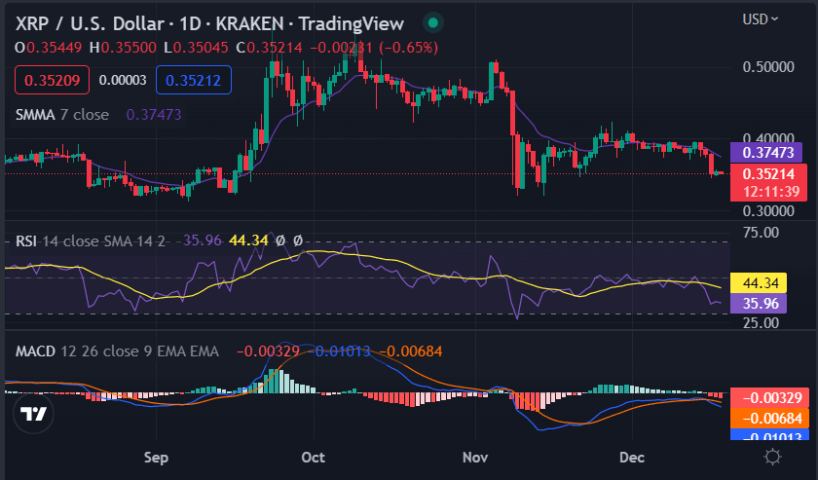
Ripple price analysis for today shows XRP is currently stuck in a consolidation phase around the $0.35 mark. The price of XRP is trading around a narrow range between the support at $0.3488 and the resistance at the $0.355 level. The bullish momentum and the bearish are still in a tug of war. The bulls are trying to push the price above the resistance at $0.355, however, the bearish pressure is prohibiting the price from breaking the resistance. The bears are still in control of the price action and if they break below the support level, XRP/USD could fall to $0.34 and potentially lower.
XRP/USD 1-day price chart: Ripple price suddenly decreased at the $0.3513 mark
The 24-hour Ripple price analysis is displaying favorable results for the sellers, as a slight drop in XRP/USD market value is being detected. The bullish momentum was just gaining its stability as the bulls were trying to retain their lead. But the bullish trend is now being hit by an opposing attack by the bears, as the price has undergone a sudden decline by getting reduced to the $0.3513 mark. The 24-hour trading volume has also gone down to $354.57 million and the market cap stands at $17.75 billion, suggesting bearishness in the market.

The SMA (Simple Moving Average) 50 and 20 are exhibiting bearishness as the price is struggling to break above the resistance. The RSI (Relative Strength Index) is also in the bearish territory and is currently at 44.34. The MACD (Moving Average Convergence Divergence) indicator is also showing that the bears are still in control as the MACD line is below the signal line.
Ripple price analysis 4-hour: Recent updates
Looking at the hourly chart, Ripple price has formed a descending triangle pattern and it is likely to break the support soon. Bearishness is dominating the market and if the bears break below the $0.35 mark, XRP/USD could go down to the $0.34 support level. However bullish might take the price above $0.355 if they manage to gain momentum and volume in their favor.

The hourly SMA 50 is currently at $0.3527 while the 20 SMA is at $0.3545, suggesting a bearish trend in the market. The RSI (Relative Strength Index) is also in bearish territory and is currently at 30.59, indicating a downward trend. The MACD (Moving Average Convergence Divergence) indicator is also showing that the bears are in control as the MACD line is below the signal line.
Ripple price analysis conclusion
Overall, the Ripple price analysis market has seen a slight decline recently as bearish pressure is dominating the market. The bulls are still trying to gain back their dominance, but it looks like the bears are in control as of now. The support levels at $0.35 and $0.34 should be closely monitored, and if the price breaches them, further decline is expected.


